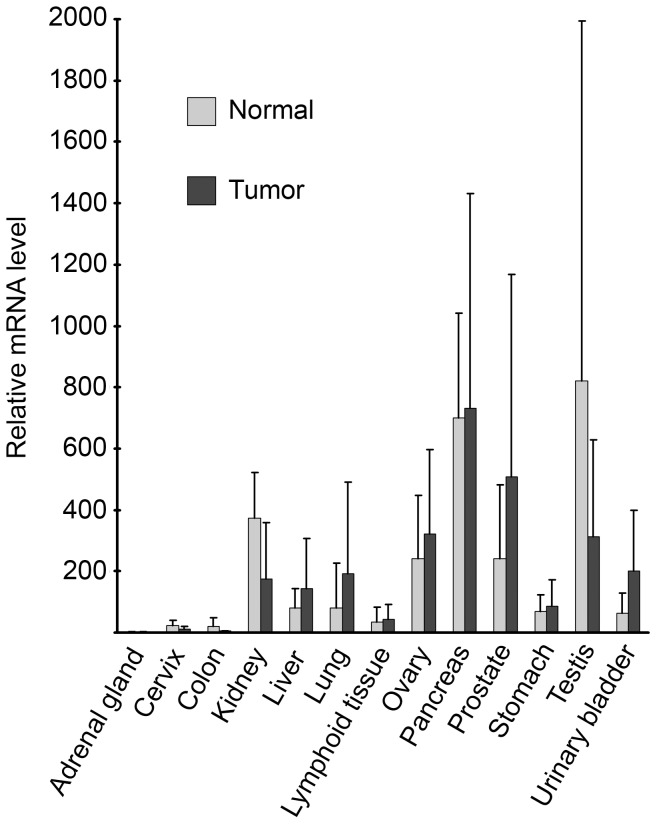
Figure 3. Expression of ENDOV in human cancers.
Transcript profiling was performed using a cancer tissue qPCR array and primers amplifying exons 6 to 8 of ENDOV. cDNA levels are normalised to β-ACTIN. ENDOV mRNA levels were calculated relative to the tissue with lowest expression level (adrenal gland). Tumour and normal tissue were grouped according to their origin and the average and standard deviation were calculated for each group. The experiment was performed twice with similar results.

