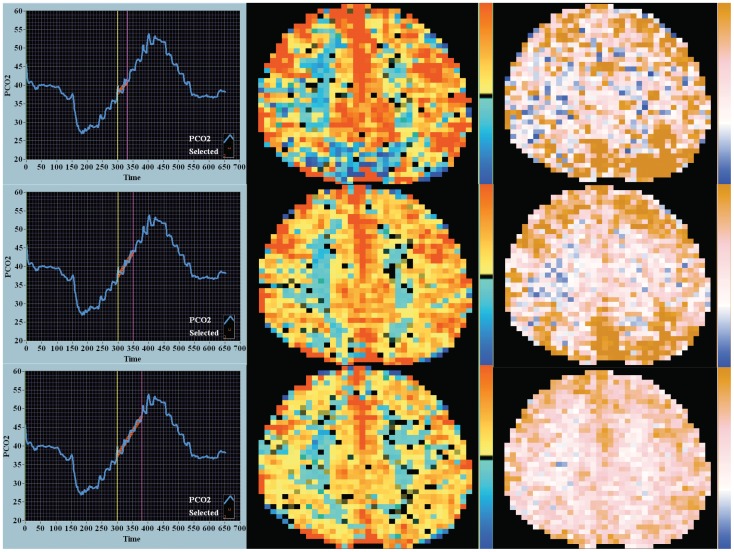
Figure 2. Response to ramp CO2 stimulus – CVR and DFA maps.
The CO2 ramp stimulus is shown in the first column. The duration of the ramp stimulus increases by row. Not shown in this image is the end-tidal O2 tension which is stable over time at normal values (approximately 100 mmHg). The yellow and magenta vertical markers highlight the center of the CO2 durations analyzed in the square wave sequence. The highlighted red lines demonstrate the interpolated points where the CO2 tension was correlated to the MR–BOLD signal for the DFA analysis. The CVR maps are shown in second column and the DFA maps in the third column. In the first time period CVR map (row 1, column 2) the deep saturation of red signal indicates initial very high responsiveness (steep slope) within these areas suggesting these voxels are on the steep linear portion of the sigmoidal CO2 response curve. In the DFA map (row 1, column 3) these areas are noticeably brown with a Hurst exponent of 1.5 indicating very high time memory. The ramp change in end-tidal CO2 examined is 8 mmHg. The color keys are as in Figure 1.

