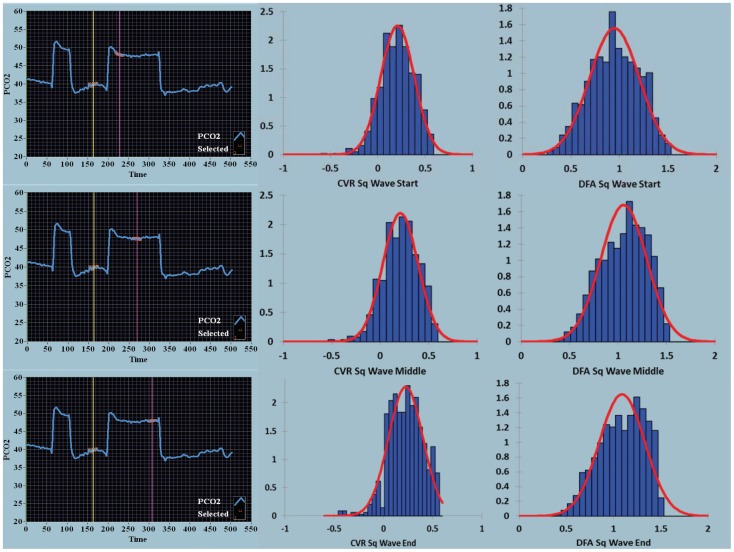
Figure 3. Density histograms over time for the square wave stimulus for CVR and DFA maps.
The square wave sequence is shown in the first column, as defined in Figure 1. The second column shows the density histograms for the CVR output range shown on the x-axis (−0.56–0.56 BOLD units/mmHg CO2). The third column shows the density histograms for the DFA output range shown on the x-axis (0–1.5 Hurst exponent units). The red bell-shaped curves seen with the histograms are best normal curve fit to the histogram data. For the square wave sequences from start, middle and end, the mean and coefficient of variation for the CVR maps were 0.207, 0.855; 0.209, 0.871; and 0.227, 0.175 respectively, and for the DFA maps 0.947, 0.269; 1.06, 0.224; and 1.09, 0.222.

