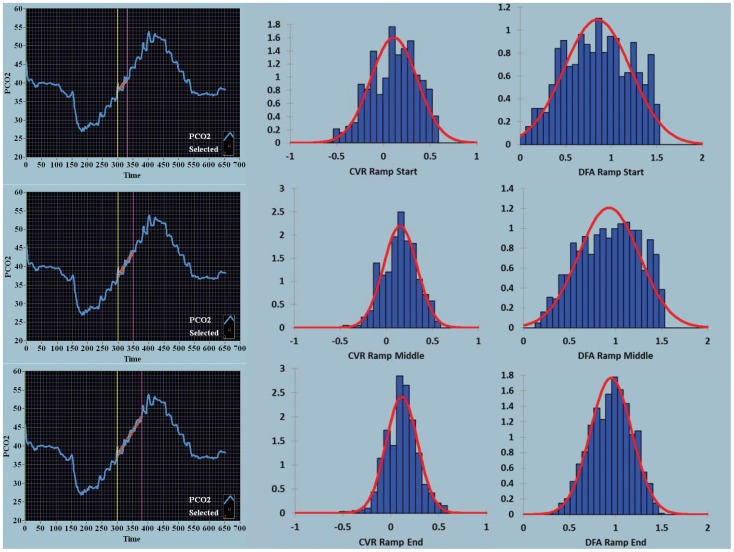
Figure 4. Density histograms over time for the ramp stimulus for CVR and DFA maps.
For the ramp sequences from start, middle and end, the mean and coefficient of variation for the CVR maps were 0.113, 2.203; 0.151, 1.197; and 0.116, 1.422 respectively and for the DFA maps 0.847, 0.432; 0.929, 0.355; and 0.951, 0.237. Same color coding as in Figure 3.

