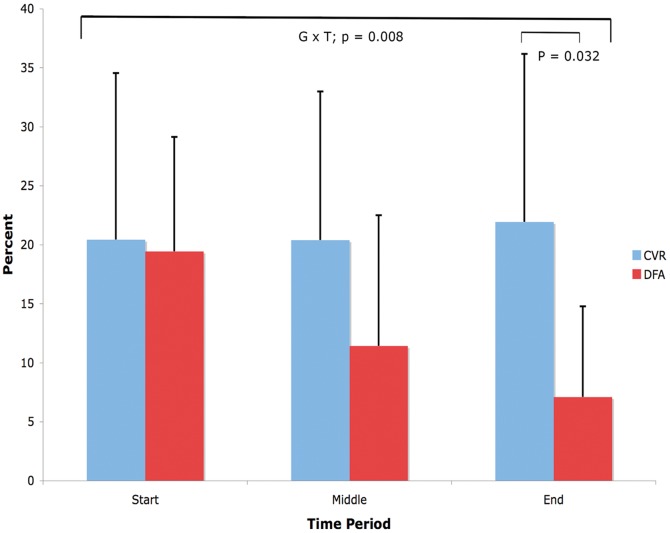
Figure 5. Change in percentage of ‘blue’ voxels over time in CVR and DFA maps.
Mean percentage of ‘blue’ voxels for the CVR (0 to −0.56 BOLD units/mmHg CO2) and DFA (0.5 to 0 Hurst exponent units) maps for the 8 patients with carotid steno-occlusive disease. All patients had square wave CO2 stimuli. A significant difference in mean percentage of ‘blue’ voxels was seen between CVR and DFA for the end time period.

