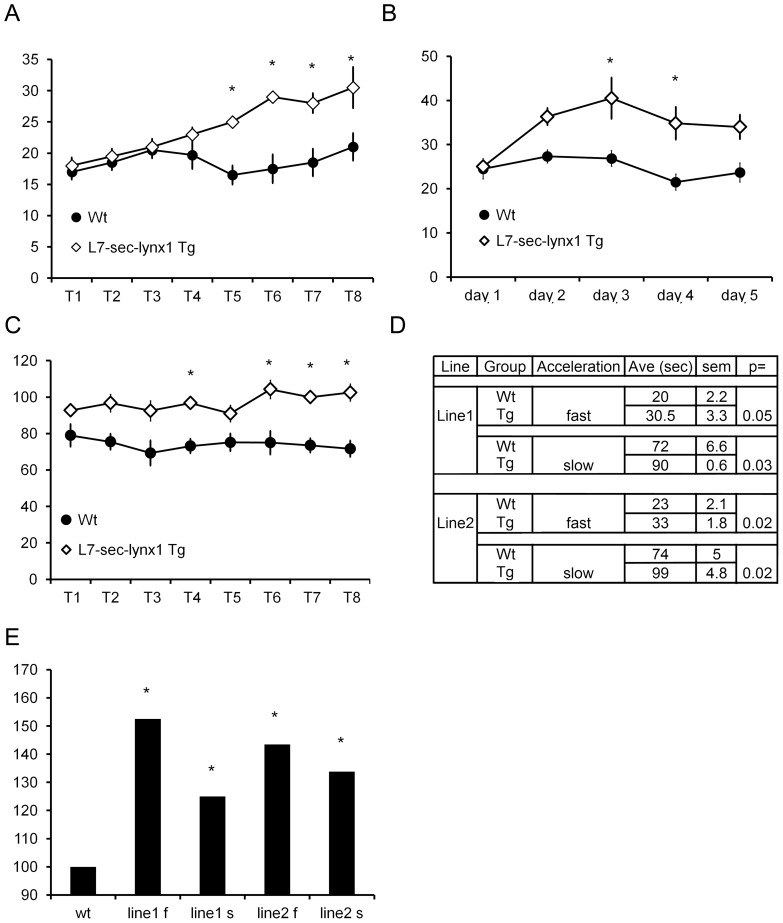
Figure 2. Rotarod performance for L7-sec-lynx1 transgenic mice.
(A) Line 1. No differences in performance were observed initially, but the transgenic mice (L7-sec-lynx1 Tg) outperformed their wild-type littermates beginning at the 5th trial. These data indicate that there are no motor performance differences in the transgenic mice vs. wildtype mice, but that there is a significant improvement in motor learning behavior. Y axis is in seconds; X axis is trial number. P<0.05. (B) Line 1. Motor performance over five consecutive training days. Average of all trials per day indicates a significant performance enhancement in L7-sec-lynx1 Tg as compared to their wild-type littermate controls. Y axis is in seconds, X axis is in days. (C) Line 2. Motor performance using a slow acceleration rotarod paradigm (0.1 RPM/sec). Significant enhancements in rotarod performance in L7-sec-lynx1 Tg mice were observed in latter trials. Y axis is in seconds; X axis is in trials. P<0.05. (D) Table of data collected for two independent founder lines of the L7-sec-lynx1 transgene tested on an accelerating rotarod paradigm, with two separate acceleration paradigms of the rotarod test (modes) used, slower (0.1 RPM/sec.) and faster (1 RPM/sec.) accelerating paradigm. In both paradigms, both L7-lynx1 transgenic mouse lines demonstrated a significant enhancement in motor learning but no differences in baseline motor performance. (E) Summary of the effects of motor learning on the two lines of the same L7-sec-lynx1 transgenic mice. The maximal daily performance from all training days is plotted as a percentage relative to wild-type. “f” and “s” suffixes refer to the faster or slower acceleration, respectively.

