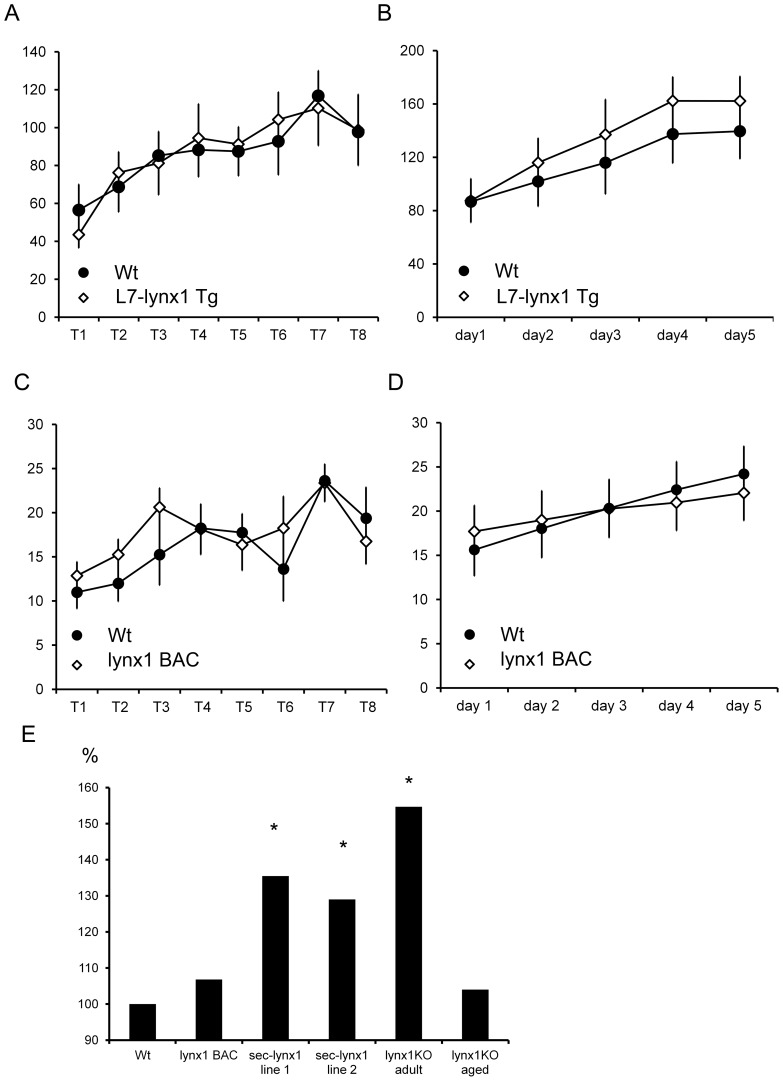
Figure 3. Comparison of motor learning effects across several genetically modified lynx lines.
Overexpression lines, L7-lynx1 and lynx1BAC mice, which over-expressed full length lynx1 in Purkinje cells, and lynx1-expressing cells, respectively, did not display significant differences in motor learning. (A) L7-lynx1 transgenic mice, overexpressing full length lynx1 in Purkinje cells, showed no differences in motor performance or learning as compared to their wild-type counterparts. Y axis is in seconds, X is in trials. (B) L7-lynx1 transgenic mice exhibited no learning improvements over that of wild-type littermates. Y axis is in seconds, X axis is in days. (C) lynx1 BAC transgenic mice showed no difference in motor performance as compared to wild-type littermates in initial training trials on the rotarod. Y axis is in seconds, X is in trials. No significant differences were observed. (D) On subsequent training days, lynx1BAC mice did not show a difference in motor learning. Y axis is in seconds. No significant differences were observed. (E) Comparisons of motor learning across lines. Data is represented for each line as a percentage over the performance of their wild-type counterparts. The improvement in motor learning of L7-sec-lynx1 transgenic mice contrast with expression of full-length lynx1 using lynx1BAC transgenesis. Rotarod motor learning was also sensitive to removal of lynx (lynx1 KO), and demonstrated a significant increase over wild-type controls. Aged mice, (>1 yr), showed no motor enhancements unless treated with nicotine [16]. Y axis is percentage over wild-type controls. Data depicted represent the seventh training trial for each group.

