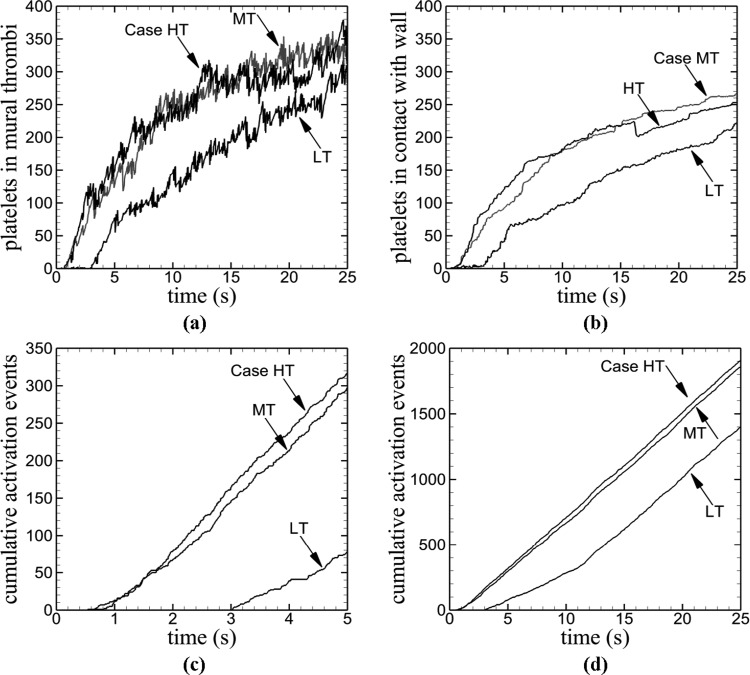
Fig. 5.
Time variations of measures of thrombus formation in venules for different tortuosity values (Cases LT, MT, HT), including: (a) number of platelets in mural thrombi, (b) number of platelets in contact with the wall, (c) cumulative number of activation events near the time of thrombus initiation, and (d) cumulative number of activation events during the entire simulation

