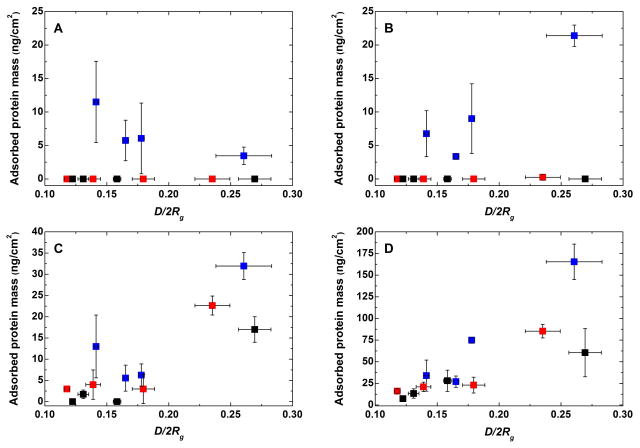
Figure 1.
Adsorbed protein mass from (A) HSA, (B) Fbg, (C) Lys, and (D) HBP versus the structure of the PEO chains. PEO-N(H)-PDA (black), PEO-S-PDA (red), and PEO-S (blue) anchored on gold are shown. The bare gold surfaces used in this study revealed accumulation of 93 ± 3, 265 ± 46, 112 ± 18, and 293 ± 70 ng/cm2 of adsorbed HSA, Fbg, Lys and HBP, respectively. The fouling on PDA surfaces was on the same level of adsorbed protein mass as in the case of bare gold. The detection limit of the measurements was 0.7 ng/cm2.

