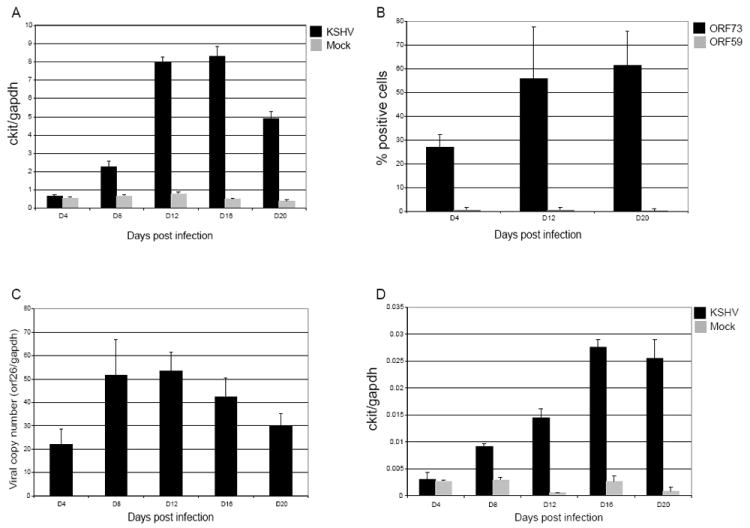
Figure 1. c-kit mRNA levels, late and lytic viral protein expression and viral copy number during a KSHV infection.

To assess the kinetics of c-kit upregulation during a long-term KSHV infection, eDMVEC (A) and primary DMVEC (D) were either mock (grey bars) or KSHV-infected (black bars) as described in materials and methods. RNA was isolated at the indicated times, qPCR for c-kit and gapdh was performed and c-kit levels were then normalized to gapdh levels. The data shown is representative of at least two independent infection timecourses. To analyze late and lytic viral protein expression, KSHV-infected eDMVEC were fixed and stained for ORF73 (late) and ORF59 (lytic) viral proteins (B). The percentages of positive cells in 5 imaged fields are depicted in the graph. To quantitate the viral copy number for the eDMVEC infection, DNA was isolated from the indicated times and qPCR for ORF26 and gapdh was performed (C). The ORF26 copy number relative to the copies of gapdh is shown in the graph. Error bars represent the standard deviation from duplicate qPCR reactions.
