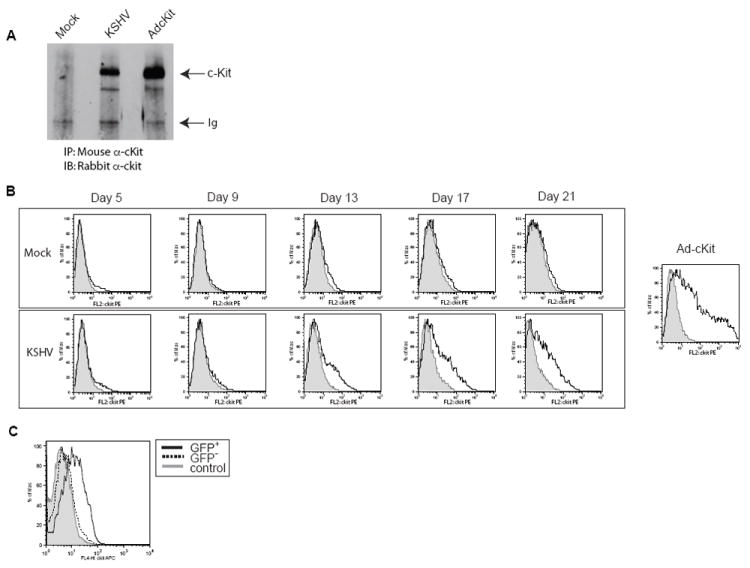
Figure 2. c-Kit protein expression and cell surface localization.

To verify that the upregulation of the c-kit message by KSHV correlated with an increase in c-Kit receptor that was properly localized to the cell surface, immunoprecipitation/immunoblots (A) and flow cytometric analysis (B) were performed on Mock-, latent KSHV-, and Ad-c-Kit-infected eDMVEC cells. (A) Total c-Kit protein levels were determined by a combination of c-Kit immunopreciptations (IP) from the indicated cells followed by c-Kit immunoblots (IB). (B, upper panel) Flow cytometric analysis for cell surface c-Kit was performed on Mock-infected eDMVEC at the indicated days post infection. The solid lines represent cells stained with a c-Kit antibody conjugated to PE and the shaded areas represent cells stained with a PE-conjugated isotype control. (B, bottom panel) Flow cytometric analysis for cell surface c-Kit was performed on KSHV-infected eDMVEC at the indicated days post infection. The solid lines represents cells stained with a c-Kit antibody conjugated to PE and the shaded areas represent cells stained with a PE-conjugated isotype control. Ad-c-Kit infected eDMVEC are shown for comparison (far right). The Y axis represents cell number as the percent maximum and the X-axis represents PE fluorescence intensity (C) Flow cytometric analysis for cell surface c-Kit was performed on rKSHV.219-infected eDMVEC at three weeks post-infection. The solid line represents GFP positive cells stained with a c-Kit antibody conjugated to APC, the dashed line represents GFP negative cells stained with the same c-Kit antibody and the shaded histogram represent cells stained with an APC-conjugated isotype control antibody.
