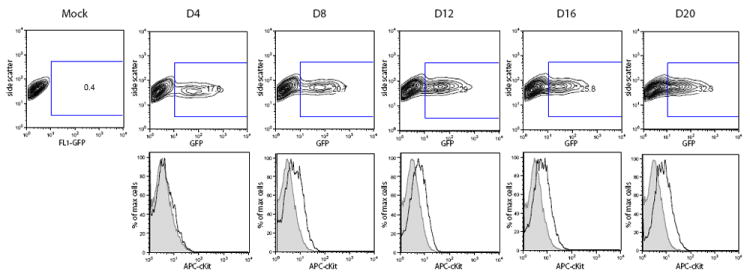
Figure 3. Viral spread and c-Kit expression during a KSHV infection.

To determine whether c-Kit induction correlated with an increase in KSHV-infected cells, flow cytometric analysis of GFP expression in both mock and rKSHV.219 infected eDMVEC were performed at the indicated days post infection. The contour plots in the top panel show the percentage of GFP positive, KSHV-infected cells at each timepoint. The corresponding histograms in the bottom panel show c-Kit expression of the mock (shaded) or GFP-positive/rHSKV.219-infected (black) cells. The inset rectangles in the top panel are the gates used to denote GFP-positive cells.
