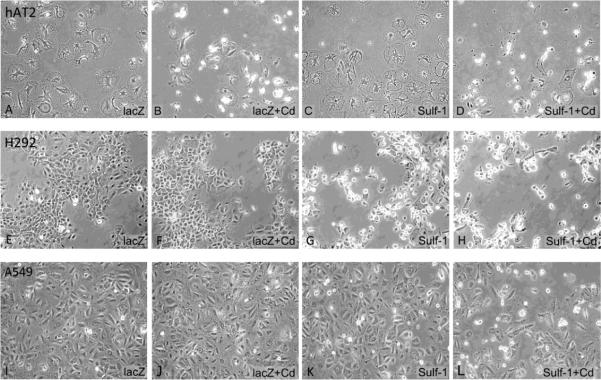
Figure 1.
Representative photomicrographs of hAT2, H292, and A549 cells over-expressing HSulf-1 and/or treated with cadmium. hAT2 cells (A – D), H292 cells (E – H), and A549 cells (I – L) were exposed to 10 μM cadmium for 48 hours after adenoviral transduction for lacZ or HSulf-1 over-expression. Photomicrographs were taken under a phase contrast microscope (200× magnification). (A), (E), and (I), lacZ transduction; (B), (F), and (J), lacZ plus cadmium; (C), (G), and (K), HSulf-1 transduction; (D), (H), and (L), HSulf-1 plus cadmium.

