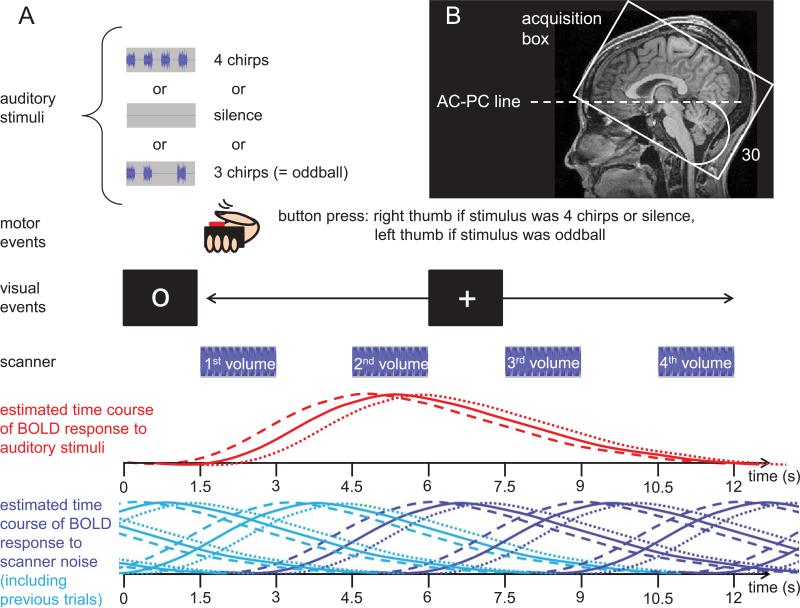
Figure 1.
Illustration of the scanning paradigm. (A) Time-course of a trial. At the beginning of each trial, an auditory stimulus was presented, accompanied by a fixation circle. After 1.5 seconds, the fixation circle changed to a + sign, signaling participants to indicate via button press whether the stimulus they had just heard was “normal” or an “oddball”. At the same time, the first volume acquisition started. After three additional volume acquisitions (each preceded by 1.5 seconds of silence), the next trial began. Volume acquisitions were timed so as to capture the rise and fall of the expected hemodynamic response to the auditory stimuli. The dashed red line indicates the response locked to chirp onset, the dotted line the response to chirp offset, and the solid line represents the hemodynamic response relative to the middle of the auditory stimulus, which was used for modeling the hemodynamic response function in the GLM. The dark blue lines indicate the BOLD responses to the noise associated with each of the scans shown. The light blue lines indicate the BOLD response to scanner noise in a preceding trial. As becomes evident from this illustration, the frequent and regular occurrence of scanner noise creates a continuously elevated level of activation. Any effects evoked by experimental stimuli and/or task are measured relative to this elevated baseline level. (B) To improve signal in inferior frontal areas, the volume acquisition box was tilted 30 degrees from the line connecting the anterior and posterior commissure (AC-PC line) to avoid intersection of MRI slices with the sinuses.

