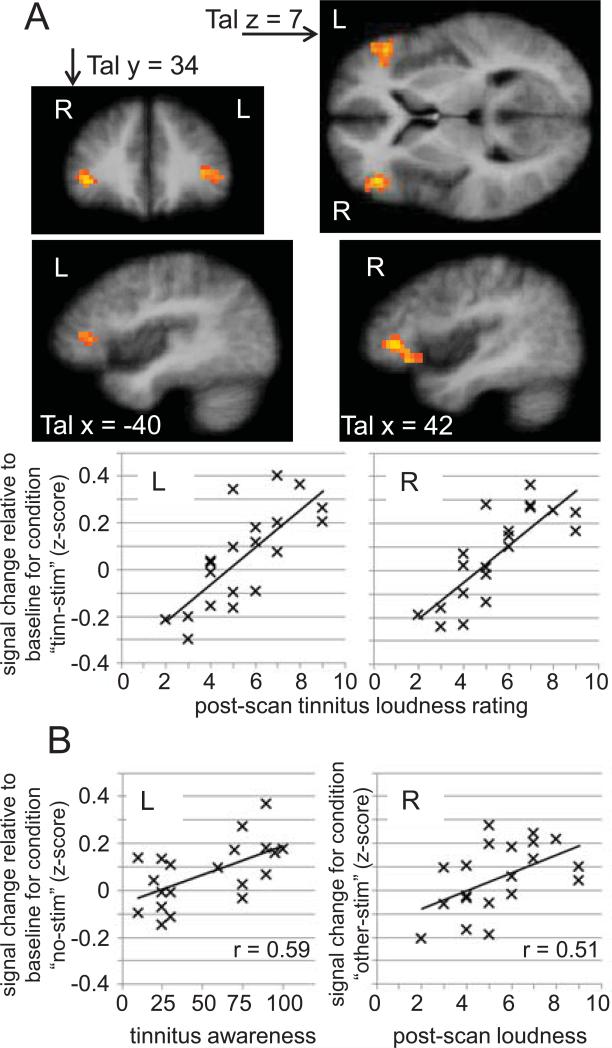
Figure 6.
Tinnitus correlations in left and right inferior frontal gyrus (IFG). (A) The bilateral clusters were identified in a whole-brain correlation analysis for displaying a significant (r > 0.60) correlation between the BOLD response on “tinn-stim” trials and tinnitus loudness as rated immediately after the scan. The scatterplots below illustrate the correlation, averaged across all voxels of each cluster. As in Figures 2 and 5, these scatter plots are merely shown to demonstrate that the correlations were not driven by a few outliers; however, note that the depicted correlations overestimate the true effect size (of which we can only say that it exceeds r > 0.60), since the voxels over which we averaged were selected for displaying a significant correlation in the whole brain analysis (Vul et al., 2009). (B) In addition to the correlations for which the clusters were identified, both clusters also displayed positive correlations between the BOLD response on “no-stim” trials and tinnitus awareness ratings (shown here is the correlation for left IFG, which exceeded 0.50). Note, however, that this correlation may at least partly be caused by the correlation between tinnitus loudness ratings and tinnitus awareness ratings (see Table S1). Both clusters also showed correlations between the BOLD response on “other-stim” trials and post-scan tinnitus loudness ratings (shown here is the correlation for right IFG, which exceeded 0.50).

