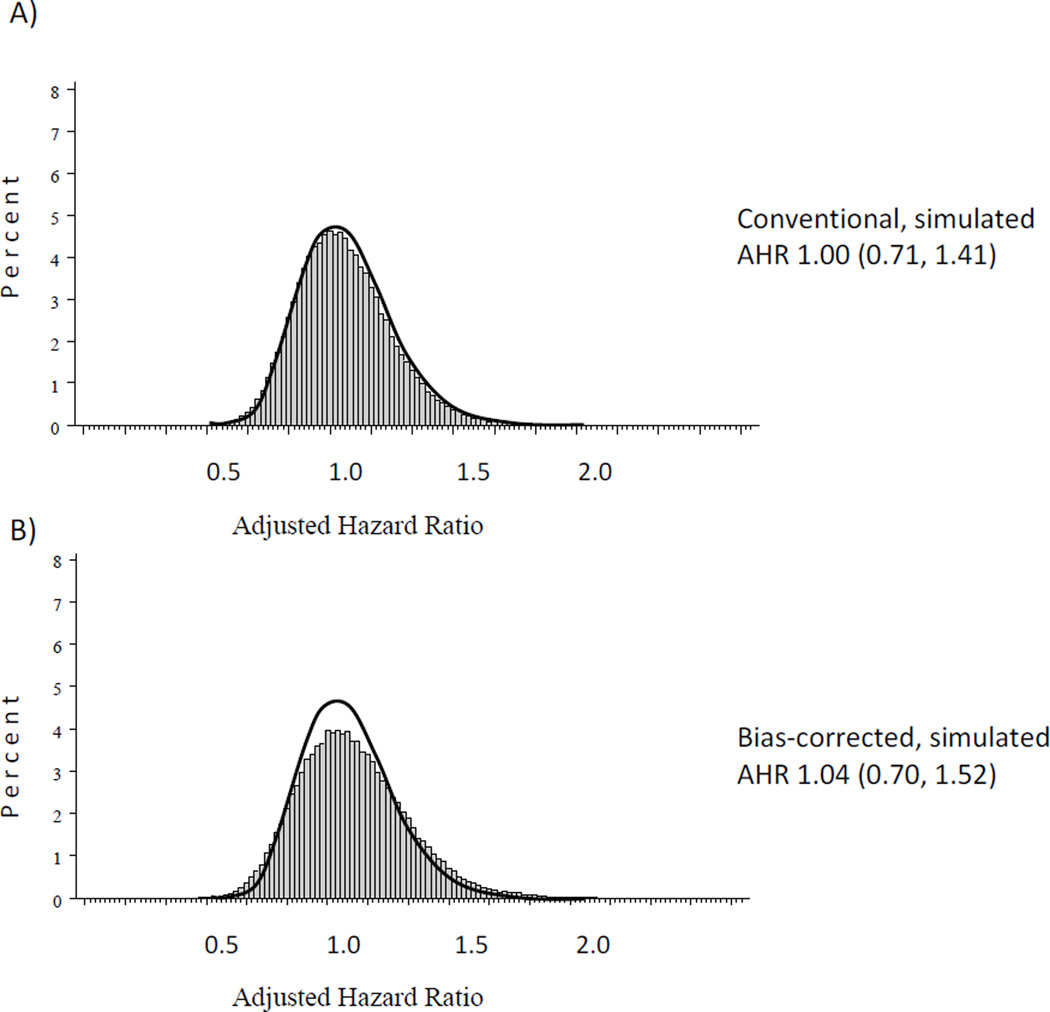
Figure 3.
Histograms of simulated adjusted hazard ratios (AHR) and median AHRs and 95% simulation intervals for the A) conventional and B) bias-corrected analyses of the association between influenza vaccination during pregnancy and preterm birth. The thick black line outlines the simulated conventional analysis AHR distribution. Models were adjusted for maternal race, age, infertility treatment, study center and multifetal gestation.

