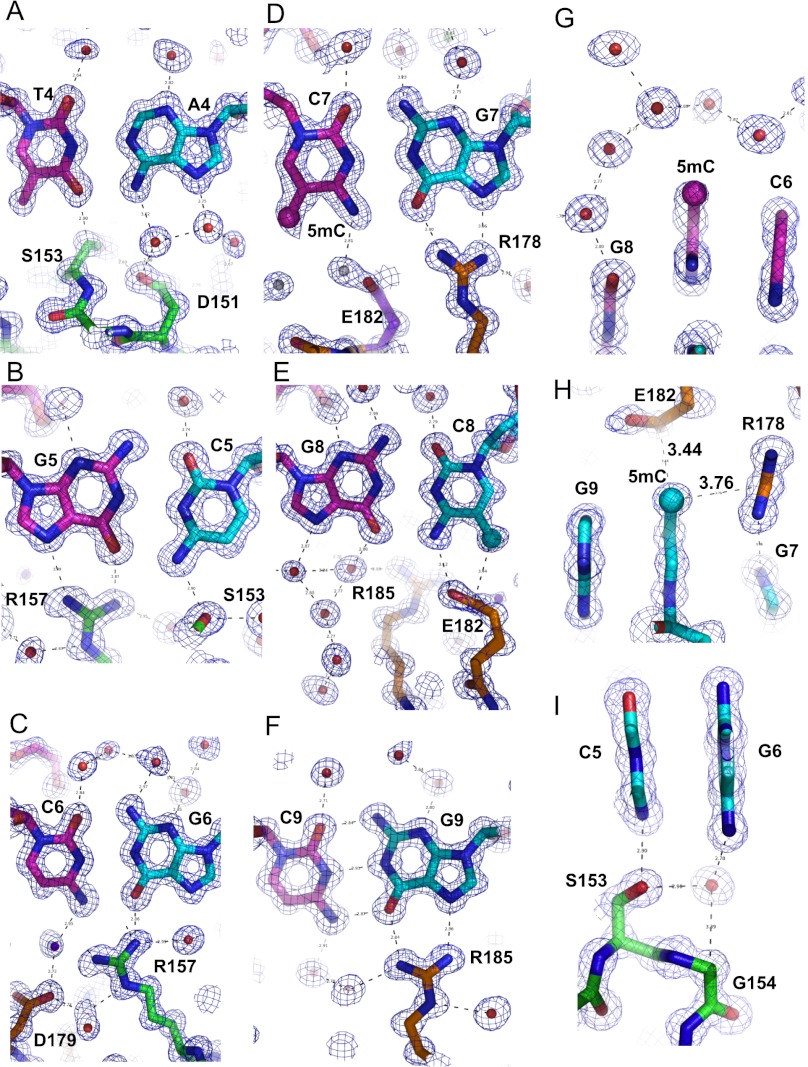
Figure 2.
Details of Zfp57–DNA base-specific interactions. (A) The T:A base pair at position 4 interacts with Ser153 and Asp151. Electron densities (2Fo–Fc) contoured at 1σ above the mean are shown. The T strand and A strand are colored in magenta and blue, respectively. (B) The interaction of the G:C base pair at position 5 with Arg157 and Ser153. (C) The interaction of the C:G base pair at position 6 with Arg157. (D) The interaction of the 5mC:G base pair at position 7 with Arg178. (E) The interaction of the G:5mC base pair at position 8 with Glu182. (F) The interaction of the C:G base pair at position 9 with Arg185. (G) A layer of water molecules shields the methyl group of 5mC at position 7. (H) Arg178 and Glu182 are in hydrophobic contact with the methyl group of 5mC at position 8. (I) Gly154 is near the unmodified cytosine at position 5 and guanine at position 6.

