
Figure 2.
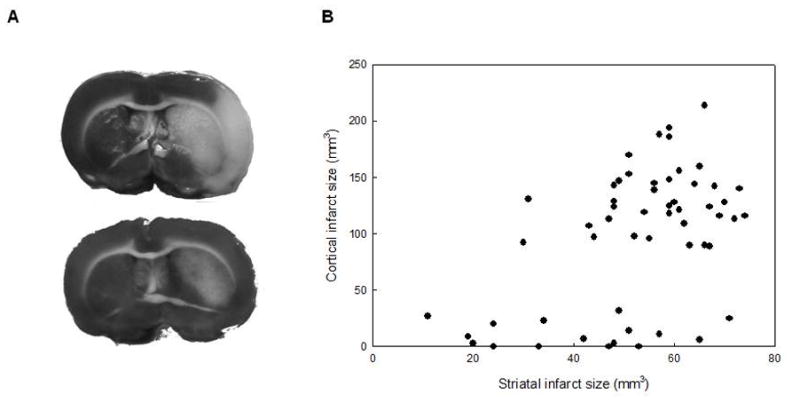
The figure represents the bimodal distribution of the cortical infarct volume. A: TTC stained sections from an animal with substantial cortical infarct (upper image) and from an animal with no cortical infarct (lower image). B: The bimodal distribution of the cortical infarct volume in all (ISO+HALO) of the filament occluded animals.