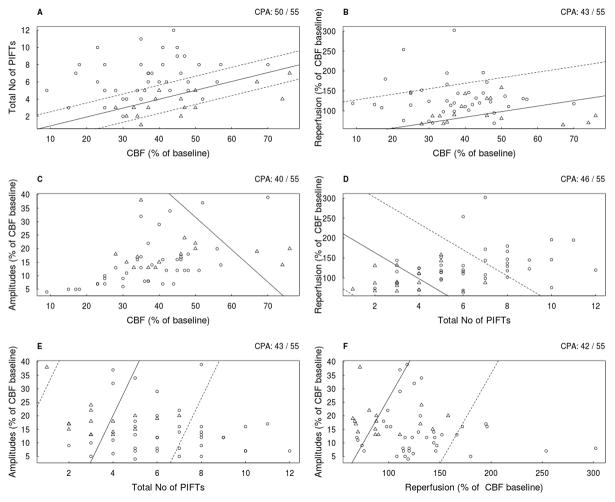
Figure 3.
The results of logistic regression analysis in all (ISO+HALO) of the filament occluded animals using two explanatory variables. Open circles represent animals with cortical infarct size larger than 80 mm3 (ci), and the triangles designate animals with negligible cortical infarcts (no) in all panels (A–F).The solid line discriminates “ci” and “no” according to the logistic regression. For example, in panel A all animals above the solid line were predicted as “ci”, and all animals below it were predicted as “no”. Note that in panel A three triangles are above the solid line and two circles are below it, thus CPA=50/55. The dashed lines represent the borders, beyond which the model will predict with at least 95% certainty, for the “ci” and the “no” animals, and if those limits are broad the dashed line may not be shown (Panel C). The CPA is indicated in the upper right corner of each panel.

