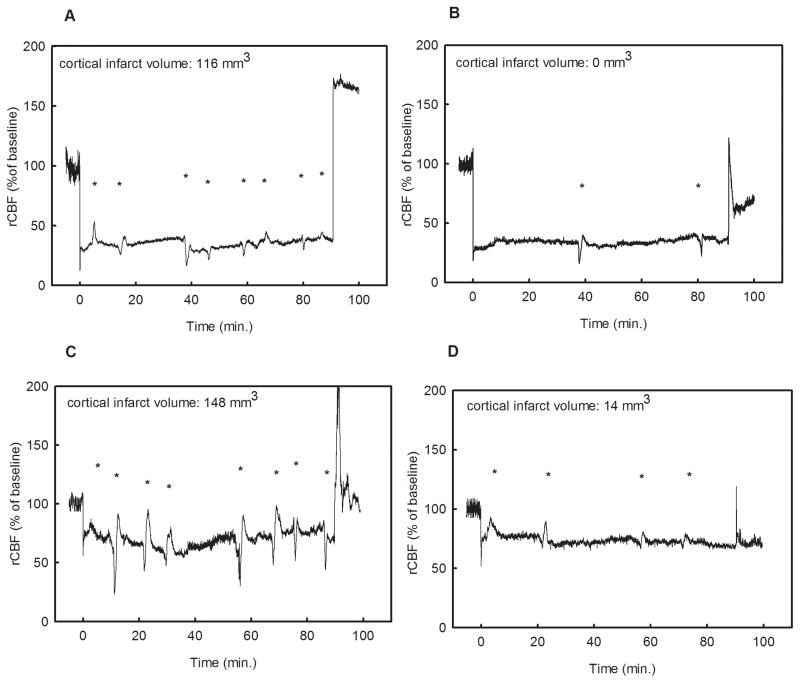
Figure 5.
Four representative flow time-courses. Panel “A” and “B” show flow traces from animals with low intra-ischemic flow (30%); the animal in panel “A” had 8 PIFTs and a large infarct (116 mm3) while the animal in panel “B” lacks the sufficient number of PIFTs and therefore did not develop a cortical infarct. Panel “C” and “D” present animals with high intra-ischemic (70%) flow. Despite a relatively high intraischemic flow, the animal in panel “C” had 8 PIFTs and showed a substantial cortical infarct (148 mm3), while animal “D” with 4 transients developed only a negligible cortical infarct (14 mm3). Asterisks represent flow transients in each panel.

