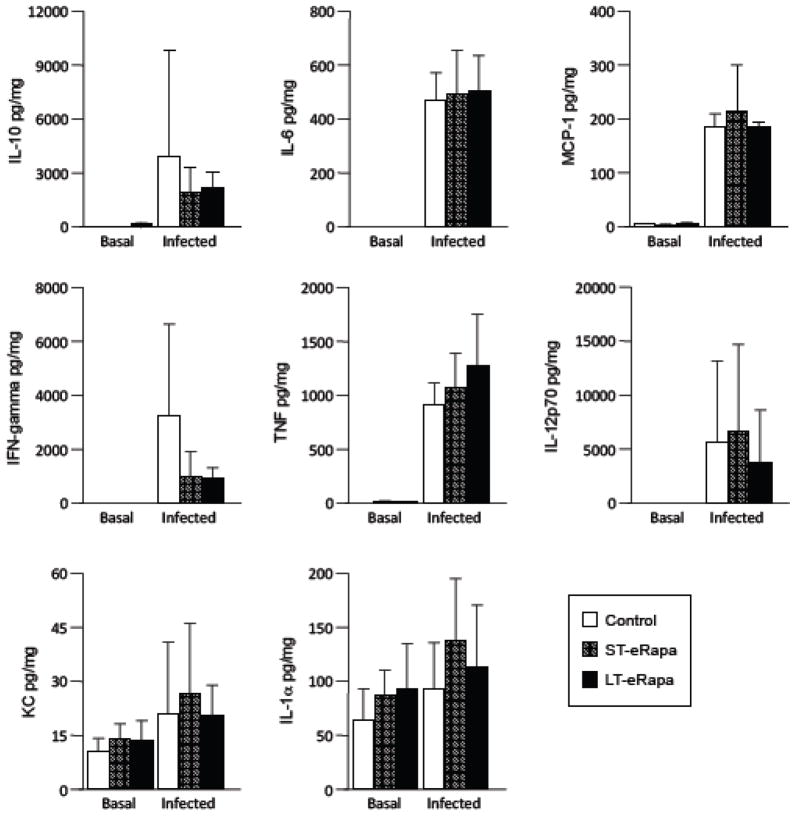
Figure 5. Cytokine and chemokine analysis in the lungs of uninfected and infected mice.
Basal and post-infection acute cytokine and chemokine profile in lungs from aged (24 month) C57BL/6 mice that had been fed rapamycin short-term (ST-eRapa: basal n=5, acute n=8), long-term (LT-eRapa: basal n=5, acute n=5), or the Eudragit (Control: basal n=3, acute n=6) diet. Mice were challenged intratracheally with 1.0 × 10³ cfu of S. pneumoniae serotype 4 strain TIGR4, lungs were collected and homogenized for cytokine/chemokine analysis. Statistical analysis was performed using a one-way ANOVA comparing the rapamycin fed groups versus the control diet. Asterisk denotes a statistically significant difference (P<0.05).

