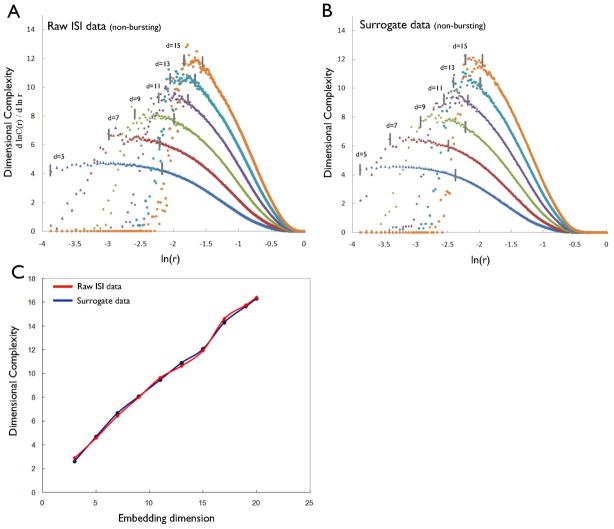
Fig. 2.
(A) DC profiles of the inter-spike interval (ISI) data from the non-bursting DA neuron as embedding dimension increases. Vertical line in each dimension denotes the selected range used to generate the average values of DC. (B) DC profiles of its surrogate data. (C) The average values of the DC of the raw ISI data (red line) and its surrogate data (blue line) as the embedding dimension increases.

