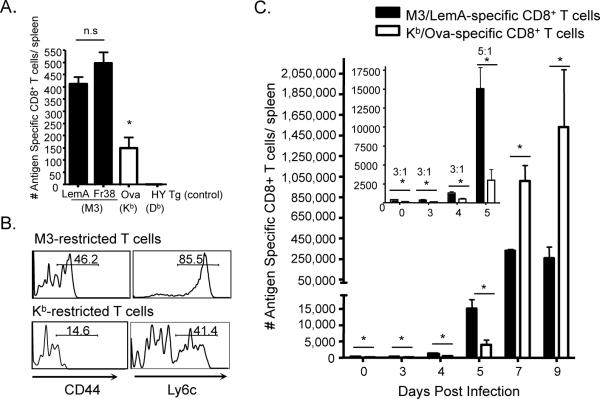
Figure 1. Differences between conventional and M3-restricted T cell kinetics reflect differences in naïve T cell precursor frequency and intrinsic T cell phenotype.
Antigen specific precursors from B6 mice were isolated and analyzed via magnetic bead assisted tetramer enrichment. (A) Bars represent the number of LemA (n=10), Fr38 (n=3) (M3-restricted) and Ova (n=3) (Kb-restricted)-specific CD8+ T cell precursors per spleen of naïve B6 mice. (The number of M3/LemA specific T cell precursors/spleen in an HY TCR Tg mouse serves as a negative control). (B) Histograms represent surface activation marker expression of M3/LemA and Kb/Ova specific CD8+ T cells isolated from spleens of B6 mice. (C) Bars represent numbers of M3/LemA and Kb/Ova specific CD8+ T cells isolated from B6 mice at different days post infection with LM-Ova. Inset: Early response (Days 0–5). Numbers indicate the ratio of LemA-specific: Ova-specific CD8+ T cells. Data are representative of at least two independent experiments and bars represent at least 3 mice per group.

