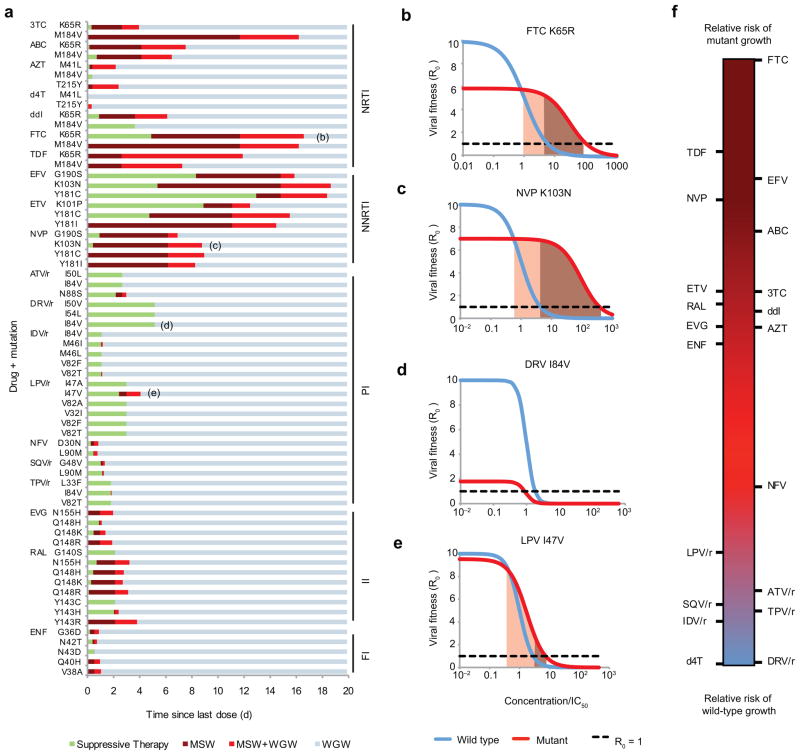
Figure 2.
Selection windows can be calculated for particular drug-mutation pairs. (a) The distance to the right along each horizontal bar is the time since the last dose, and the color corresponds to the selection window during that time interval (described in Fig. 1b) (b)–(e) Examples of dose-response curves for drug-mutation combinations indicated in (a). Shading indicates the MSW. If the cost of a mutation is too high or its benefit (ρ or σ) too low, it is possible that the MSW does not exist. (f) Rank of each drug for relative risk of wild-type versus mutant virus growth, independent of the overall risk of therapy failure. For each drug, we show a “synthetic,” worst-case, single-nucleotide mutation (Supplementary Methods, Supplementary Fig. 1). NRTI & NNRTI, (non)-nucleoside/nucleotide reverse transcriptase inhibitors; PI, protease inhibitors; FI, fusion inhibitors; II, integrase inhibitors; 3TC, lamivudine; ABC, abacavir; AZT, zidovudine; d4T, stavudine; ddI, didanosine, FTC, emtricitabine; TDF, tenofovir disoproxil fu-marate; EFV, efavirenz; ETV, etravirine; NVP, nevirapine; ATV, atazanavir; DRV, darunavir; IDV, indinavir; LPV, lopinavir; NFV, nelfinavir; SQV, saquinavir; TPV, tipranavir; EVG, elvitegravir; RAL, raltegravir; ENF, enfuvirtide. PIs are often “boosted” (co-formulated) with ritonovir (/r), which interferes with break-down in the liver and increases half-life.

