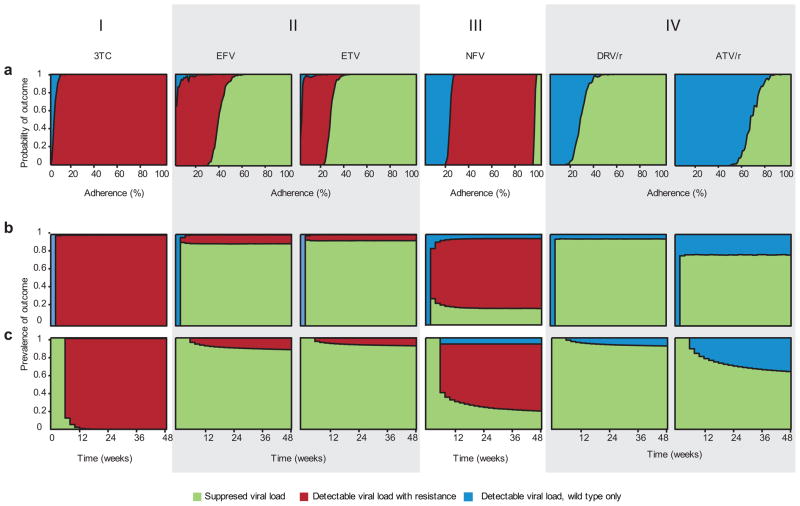
Figure 4.
Outcomes for simulated patients in a clinical trial. The height of the area shaded indicates probability of the corresponding outcome at a given adherence level (a) or time-point (b and c). (a) Adherence (x-axis) is defined as the fraction of scheduled doses taken. These are maintenance trials (see Methods). (b–c) Time is on the x-axis; measurements are taken every 2 weeks for simulated patients with a distribution of adherence levels (Supplementary Methods, Supplementary Fig. 2b). (b) Suppression trials (see Methods). (c) Maintenance trials. (I) 3TC therapy (pattern includes AZT, ABC, d4T, ENF, EVG, FTC, NVP, RAL, TDF). (II) EFV and ETV therapy. (III) NFV therapy (pattern includes ddI). (IV) DRV/r and ATV/r therapy (pattern includes ATV, TPV/r; variation on this pattern described in text includes LPV/r, SQV, SQV/r IDV, IDV/r).

