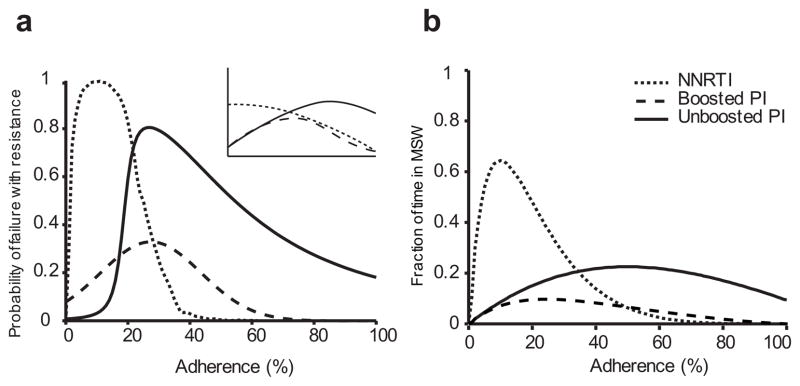
Figure 5.
Our calculated adherence-resistance relations are in agreement with those observed in clinical trials. (a) Adherence versus simulated probability of resistance in a 48-week suppression trial for a PI, a boosted PI and an NNRTI. The inset shows a qualitative summary of results from a meta-analysis of clinical trials24, which agrees with our simulations. (b) Adherence versus fraction of time spent in the MSW for the same drugs. Adherence-resistance trends demonstrate that “time in MSW” is a good proxy for the risk of mutant-based virologic failure (VF). For both plots, curves were generated by averaging over all boosted PIs, all unboosted PIs, and the NNRTIs EFV and ETV. PI curves in (a) were fitted to skewed-T distributions to smooth step-like behavior. NVP, which was excluded from this figure, displays a different pattern from the other two NNRTIs; specifically, mutant VF can occur even for perfect adherence (Supplementary Figs. 3, 4).

