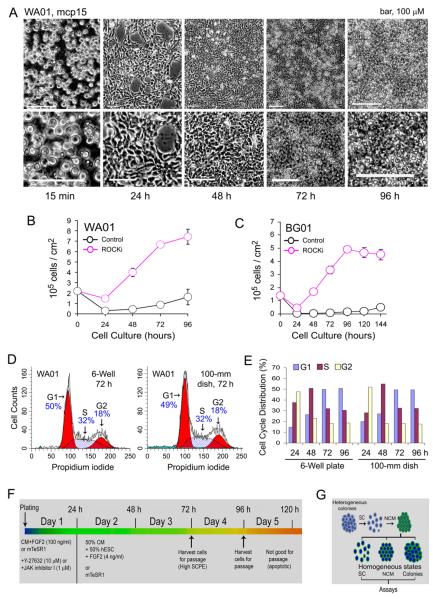
Figure 1.
Control of hESC growth rates by non-colony type monolayer (NCM) culture. (A) Representative phase images of the NCM culture of WA01 cells (passage number 15 or mcp15) at different time points after plating on 2.5% BD Matrigel with the use of 10 μM ROCK inhibitor Y-27632 (ROCKi). Phase images in the lower panel of Figure 1A are regionally enlarged views of the images in the upper panel. (B and C) Growth curves of both WA01 and BG01 cell lines were determined in 2.5% BD Matrigel in the presence or absence of 10 μM Y-27632 (ROCKi) for the initial 24-hour single-cell plating. (D and E) Cell cycle analysis was performed in WA01 cells grown under NCM conditions in both 6-well plates and 100-mm culture dishes (1.3×10⁷ cells per dish) at different time points. Representative histograms are shown. (F) A schema of the NCM culture. (G) A flow chart for the generation of homogeneous hESC conditions (e.g., SC, single cells; NCM; and the NCM-derived colonies) via the NCM intermediate step. Abbreviations: SCPE, single-cell plating efficiency.

