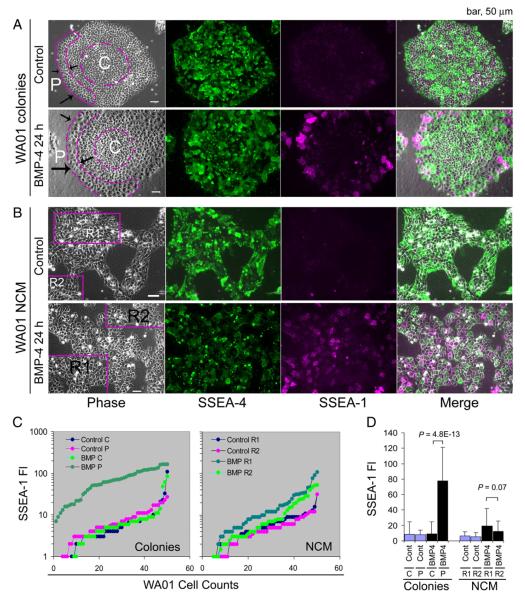
Figure 5.
Cellular responses of hESCs to BMP-4 signaling. (A) WA01 cells were grown as colonies on 2.5% BD Matrigel in mTeSR™1 medium and treated with or without 100 ng/ml of BMP-4 for 24 h. (B) WA01 cells were cultured under NCM conditions and treated with or without 100 ng/ml of BMP-4 for 24 h. Cells were fixed and immunostained with antibodies against the surface markers SSEA-1 and SSEA-4. (C) Quantitative analysis of SSEA-1 expression in cells located at central (C) and peripheral (P) regions of the WA01 colonies and in WA01 cells from different regions (i.e., R1 and R2) under NCM conditions by the ImageJ program. Initially, fifty WA01 cells were randomly assigned from the indicated regions of interest (ROI) in the phase images. SSEA-1 fluorescence intensity (FI) was then measured at the single pixel level at the plasma membrane region of each cell. SSEA-1 fluorescence intensity values were sorted and presented as line graphs in (C) to visualize the heterogeneous signaling responses. (D) Statistical analysis of the mean (columns) and standard deviation (bars) of SSEA-1 fluorescence intensity among the 50 cells presented in (C). P values were derived from an unpaired and two-sided student t-test. Abbreviations: BMP, BMP-4; Cont, BMP-4 untreated control.

