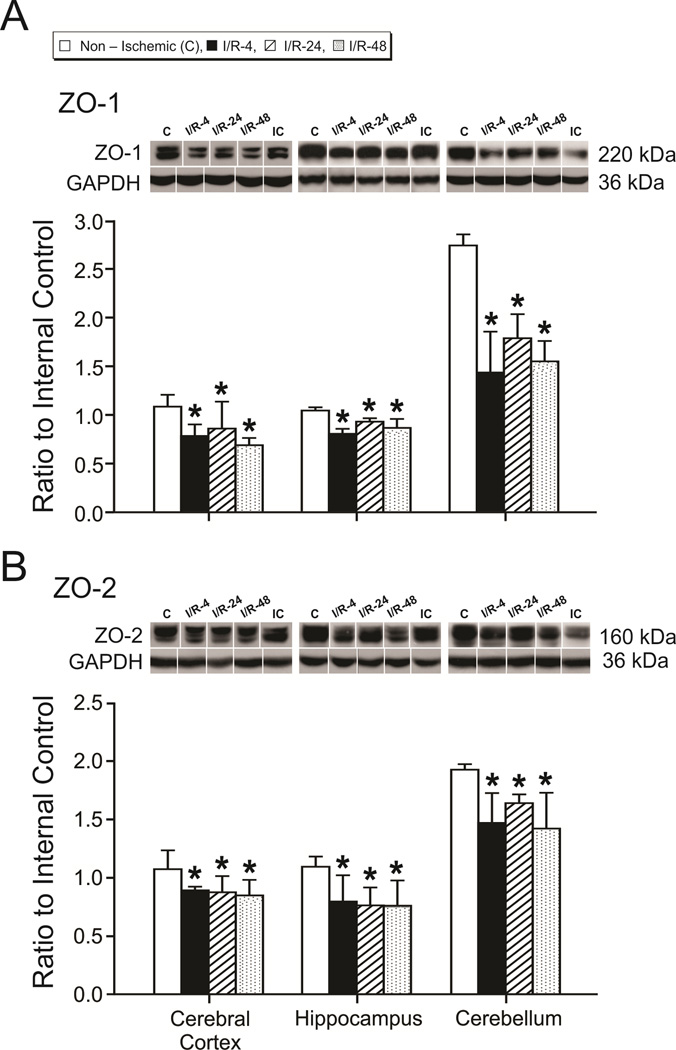
Figure 5.
Tight junction protein expression in the cerebral cortex, hippocampus, and cerebellum. Group legends and numbers as for figure 2. A. ZO-1, B. ZO-2 in the non-ischemic, I/R-4, I/R-24, and I/R-48 groups. Representative Western immunoblot shown for each tight junction protein; IC indicates the internal control standard protein derived from the same adult cerebral cortex. Values are expressed as mean ± SD. *P <0.05 vs. non-ischemic group.

