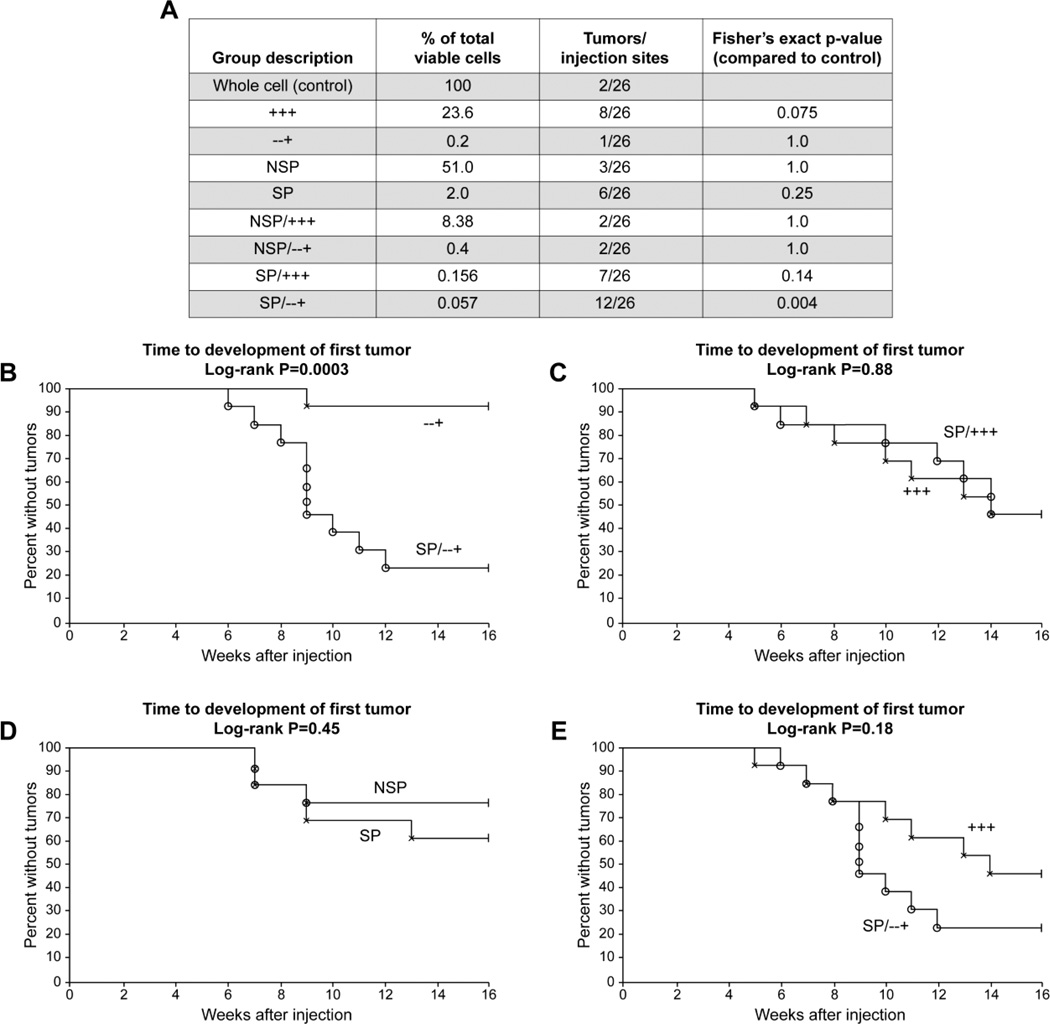
Figure 5.
Tumor-initiating capacity testing experiment. Nine different subpopulation of cells derived from SW1990 cells were xenotrasplanted. Each group was compared to a whole cell control with p-values listed. The side population CD44- CD 24-CD326+ (SP/−−+) is the only group that is statistically significantly more tumorigenic than controls (A). Further testing was done using Kaplan-Meier analysis to test whether the time to development of first tumor was different between the various groups (B–E). In comparing the following couplets: SP/−−+ vs −−+; SP vs. NSP (p = 0.45); SP/+++ vs. +++ (p = 0.88); and SP/−−+ vs. +++ (p = 0.18), only SP/−−+ vs. −−+ showed a statistically significant difference (p = 0.0003) (B).

