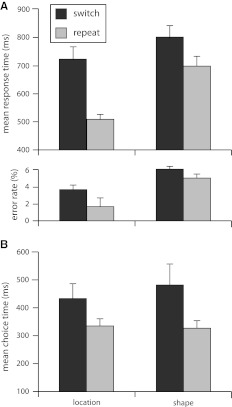
Fig. 1.
Task execution data and choice speed. Panel A depicts mean response times and error rates for the location and the shape task as a function of transition type (switch or repeat). Panel B depicts the mean time participants took before pressing the space bar as an indication that they have chosen the task to perform next. Error bars indicate SE of the mean

