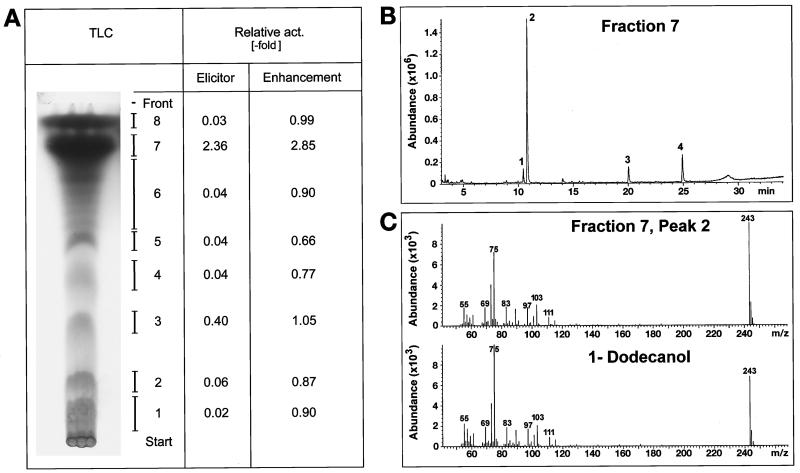
Figure 3.
Composition and biological activities of cucumber leaf cutin hydrolysate. H2O2 elicitor activity and enhancement of fungal H2O2 elicitor activity are given relative to the activity of fungal elicitor (see Fig. 1). A, Charred TLC sample. From TLC separations run in parallel, bands were eluted and solubilized at the same concentration as that present in the original hydrolysate. Since the activities of band 7 are higher compared with the values for unfractionated cucumber leaf cutin hydrolysate (Fig. 2), the active compound was obviously enriched by the TLC separation. B, GC-elution profile of TLC band 7 (peak 1 = unknown; peak 2 = 1-DDO, 75%; peak 3 = PA, 9%; and peak 4 = SA, 14%). C, Mass spectrum of peak 2 of fraction 7 and of authentic 1-DDO. The TLC bands 3 and 4 moved in the RF range of dihydroxy fatty acids but could not be satisfactorily analyzed by GC-MS even though both bands exhibited mass fragments characteristic of hydroxy fatty acids. Note that enhancement factors <1 (especially bands 2, 4, and 5) indicate that inhibitory materials might also be present.

