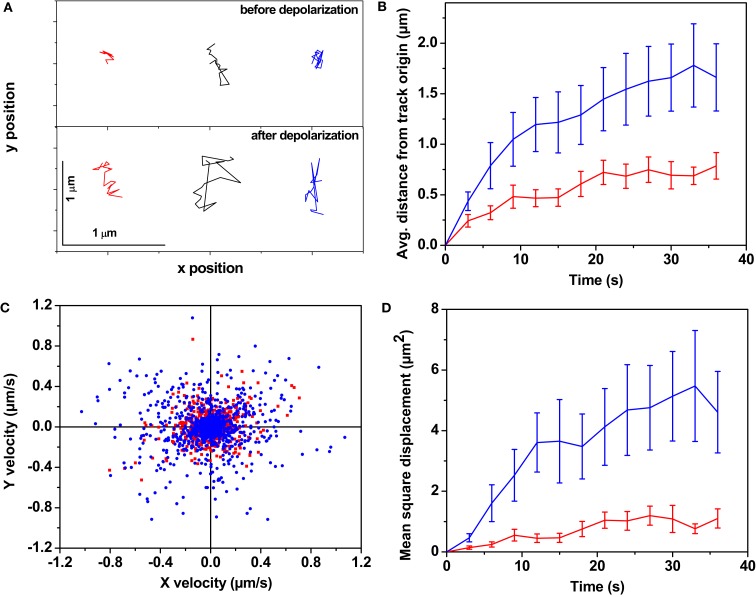
Figure 1.
The dynamics of somatic vesicles pre- and post-depolarization. Three photon excitation microscopy shows dynamics of somatic serotonergic vesicles (or unresolved vesicular clusters) in the cell body and in the processes before and after K+-induced depolarization. (A) Individual tracks of a few serotonin fluorescent spots before (top) and after (bottom) depolarization. In the following, red and blue denote measurements performed before and after depolarization respectively. (B) Average displacement from the track origin vs. time, (C) Velocity distribution obtained from the tracks, (D) Mean squared displacement vs. time. (Error bars correspond to standard errors of the mean. N = 149 fluorescent spots before depolarization and N = 137 spots after depolarization from six cells).

