Figure 1. Undifferentiated hESCs express only a subset of TFIID TAFs.
(A) Immunoblot analysis showing TAF levels in HeLa cells and H9 hESCs. β-actin (ACTB) was monitored as a loading control. (B) qRT-PCR analysis monitoring TAF expression in H9 cells relative to HeLa cells. A ratio of 1 (indicated by the red dotted line) indicates no difference in expression. Data are represented as mean ± SEM. (C) Immunoblot analysis showing levels of GTFs in HeLa cells and H9 hESCs. α-tubulin (TUBA) was monitored as a loading control. (D) Immunoblots showing TAF and TBP levels in H9 hESCs following induction of differentiation by retinoic acid treatment for 0, 3 or 6 days. OCT4 and NES were monitored as controls.
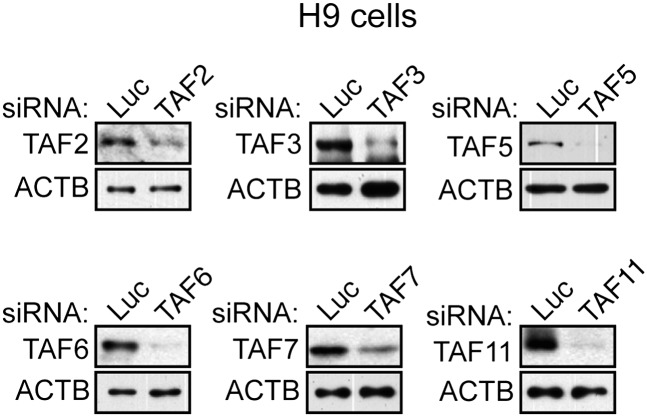
Figure 1—figure supplement 1. Confirmation of specificity of TAF antibodies by RNAi-mediated knockdown in H9 hESCs.
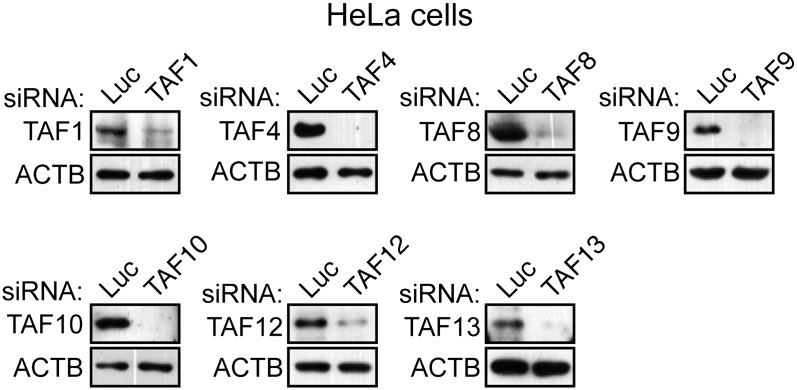
Figure 1—figure supplement 2. Confirmation of specificity of TAF antibodies by RNAi-mediated knockdown in HeLa cells.
Figure 1—figure supplement 3. TAF expression levels in H1 hESCs.


