. 2012 Nov 13;1:e00068. doi: 10.7554/eLife.00068

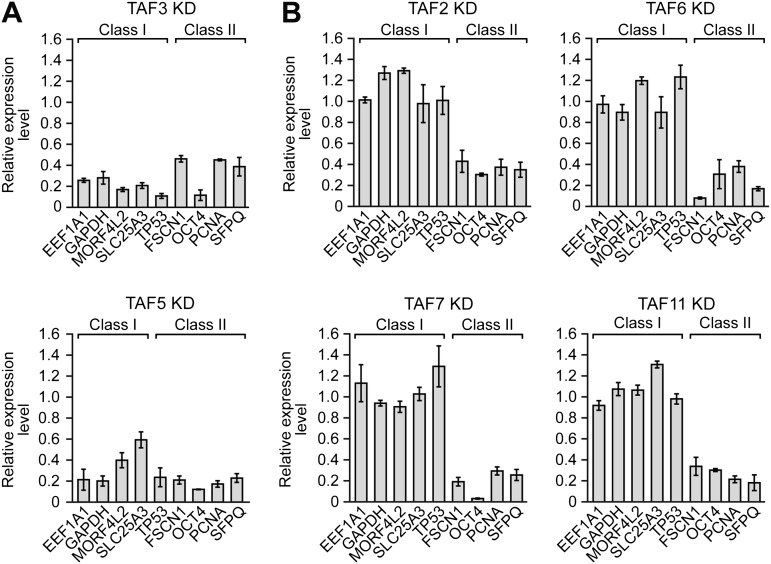
Figure 5. A strong relationship between TAF occupancy and transcriptional activity in hESCs.

(A) qRT-PCR analysis monitoring expression of class I and II genes in H9 TAF3 or TAF5 knockdown (KD) cells. Normalized Ct values were analyzed after subtracting the signal obtained with the control RN18S1 shRNA (see ‘Materials and methods’). Data are represented as mean ± SEM. (B) qRT-PCR analysis monitoring expression of class I and II genes in H9 TAF2, 6, 7, or 11 KD cells. Data are represented as mean ± SEM.

DOI: http://dx.doi.org/10.7554/eLife.00068.010

Figure 5.

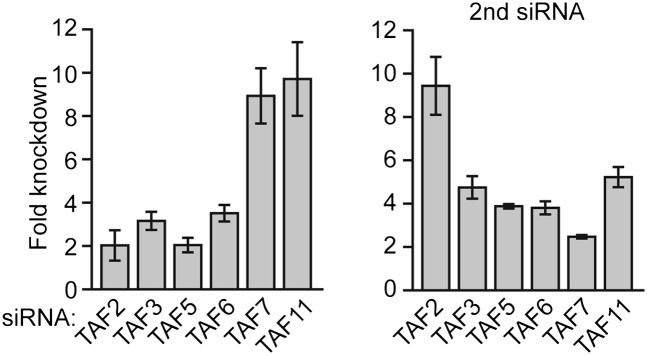
Figure 5—figure supplement 1. siRNA-mediated knockdown efficiency of TAFs in H9 hESCs.

Figure 5—figure supplement 1.

qRT-PCR analysis monitoring TAF expression in H9 cells treated with two independent siRNAs (A) directed against the indicated TAF. TAF expression is specified relative to that obtained with a control luciferase siRNA, which was set to 1. Data are represented as mean ± SD.
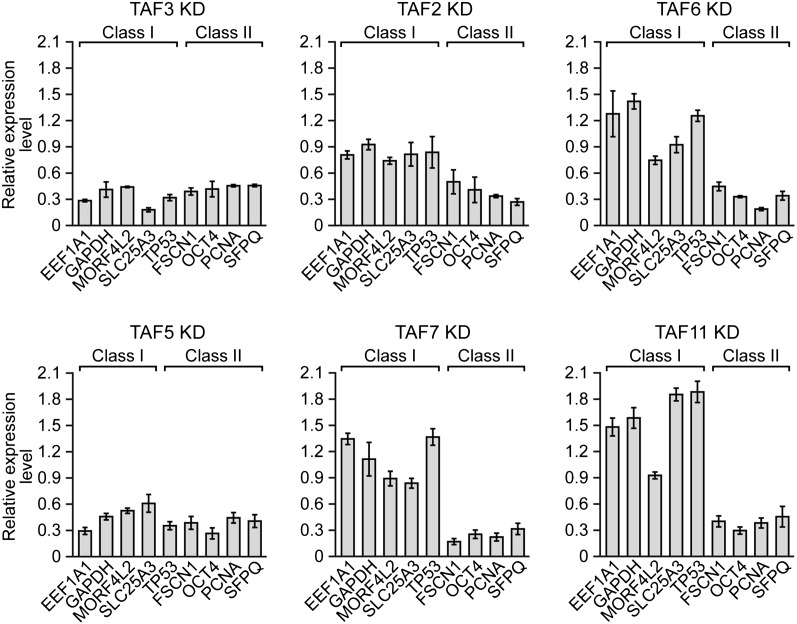
Figure 5—figure supplement 2. Confirmation of TAF requirement for transcriptional activity using a second, unrelated siRNA.

Figure 5—figure supplement 2.

qRT-PCR analysis monitoring expression of class I and class II genes in H9 cells treated with a TAF3, TAF5, TAF2, TAF6, TAF7 or TAF11 siRNA. Expression of each gene is specified relative to that obtained with a control luciferase siRNA, which was set to 1. Data are represented as mean ± SEM.