Figure 8. The composition of hESC TAFs is required for maintenance of the undifferentiated state.
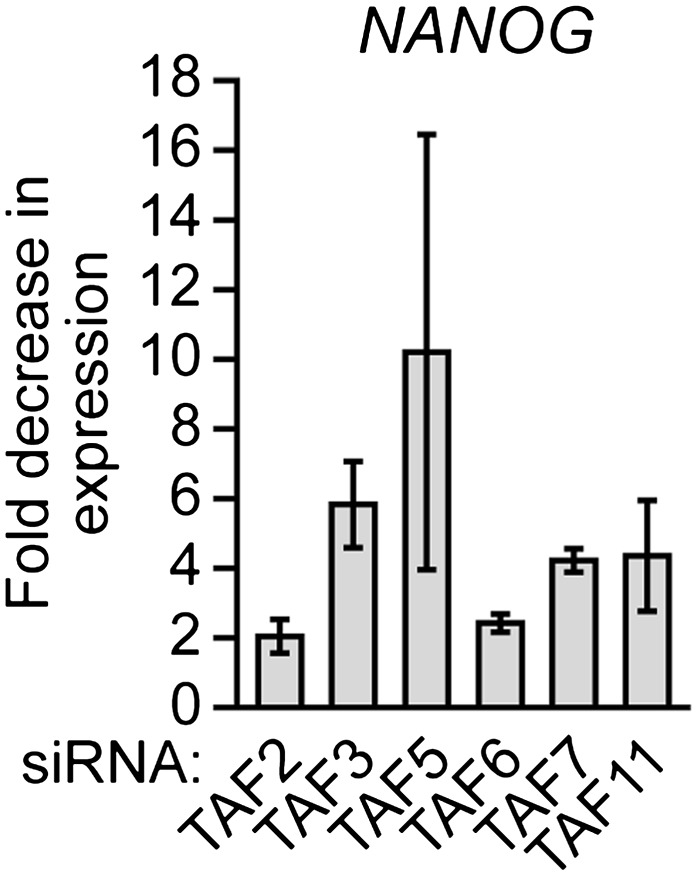
(A) Percent of H9 TAF knockdown (KD) colonies staining with alkaline phosphatase. Data are represented as mean ± SD. (B) qRT-PCR analysis monitoring expression of differentiation markers (AFP, CGB7, IGF2, NES and SOX1) in H9 cells treated with a TAF siRNA. Values are relative to those obtained with a control luciferase siRNA, which was set to 1. Data are represented as mean ± SEM. (C) qRT-PCR analysis monitoring expression of NANOG in H9 cells treated with a TAF siRNA. Values are relative to those obtained with a control luciferase siRNA, which was set to 1. Data are represented as mean ± SEM. (D) qRT-PCR analysis monitoring TAF1 expression in H9 cells transfected with a plasmid expressing TAF1 or, as a control, empty vector. Expression of TAF1 was monitored 48 hr following transfection. TAF1 expression is specified relative to that obtained with the empty vector, which was set to 1. Data are represented as mean ± SEM. (E) Alkaline phosphatase staining of H9 colonies ectopically expressing TAF1 or, as a control, vector. Data are represented as mean ± SD. (F) qRT-PCR monitoring expression of differentiation markers (AFP, CGB7, IGF2, NES and SOX1) in H9 cells ectopically expressing TAF1. Values are relative to those obtained in H9 cells expressing vector, which was set to 1. Data are represented as mean ± SEM. (G) qRT-PCR monitoring expression of class I and II genes in H9 cells ectopically expressing TAF1. Data are represented as mean ± SEM. (H) Immunoblot analysis showing OCT4 levels in H9 cells over-expressing TAFs, TBP or vector. (I) ChIP analysis monitoring recruitment of TBP, POL2 and TAF1 to the OCT4 promoter in H9 cells ectopically expressing TAF1 or vector. Data are represented as mean ± SD. (J) Schematic model. Some of the protein interactions shown are arbitrary.

Figure 8—figure supplement 1. shRNA-mediated knockdown efficiency of TAFs in H9 hESCs.

Figure 8—figure supplement 2. Validation of results presented in Figure 8A using a second, unrelated shRNA.
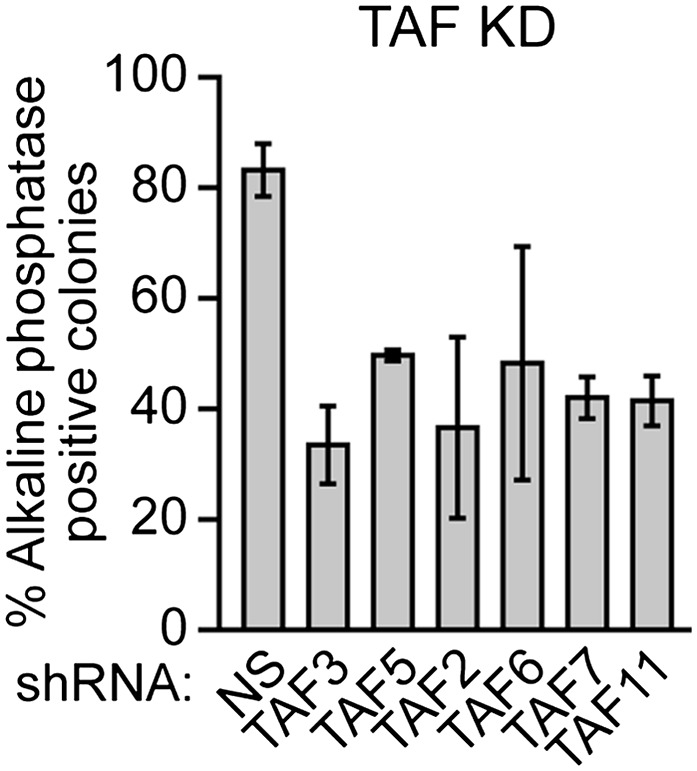
Figure 8—figure supplement 3. Validation of results presented in Figure 8B using a second, unrelated siRNA.

Figure 8—figure supplement 4. Validation of results presented in Figure 8C using a second, unrelated siRNA.