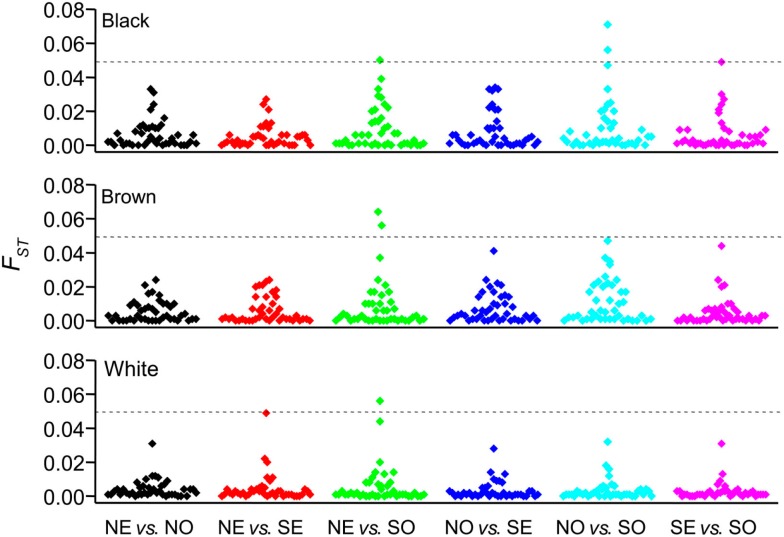
Figure 4.
Allele-specific FST values (y-axis) for pair-wise comparisons between geographical regions (x-axis). Data are presented separately for self-identified Black (top panel), Brown (middle panel), and White (bottom panel) individuals. Each symbol correspond to one of the 44 polymorphisms listed in Table 1. The dashed line shows the threshold FST values (0.05) for moderate genetic divergence. NO, North; NE, Northeast; SE, Southeast; SO, South.

