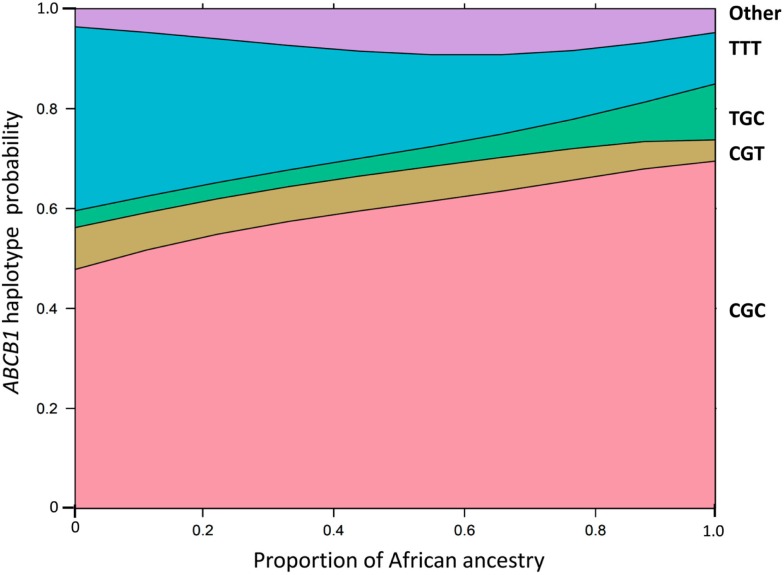
Figure 5.
Effect display for the distribution of ABCB1 haplotypes in the logit model fit to the data for African ancestry in 965 Brazilians. The haplotypes comprising the 1236C > T, 2677G > nonG, and 3435C > T SNPs are shown at the right of the plot. The individual proportion of African ancestry is shown in the x-axis. The y-axis is labeled on the probability scale. The plot was generated as described by Venables and Ripley (2002) and implemented as function “multinom” available in the R package “nnet.” Data from Sortica et al. (2012).

