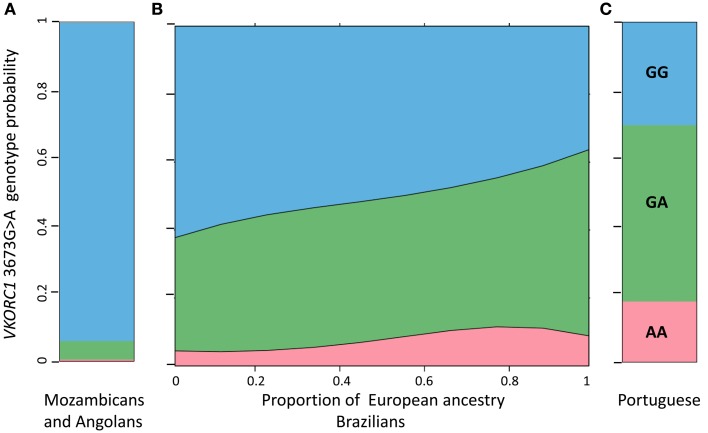
Figure 6.
Effect display for the distribution of VKORC1 3673G > A genotypes in the logit model fit to the data for African ancestry in 965 Brazilians (B). For comparison the frequency of each genotype in a cohort of Angolans and Mozambicans [n = 216, (A)] and in a Portuguese cohort [n = 89, (C)] are also shown. The individual proportion of African ancestry in Brazilians is shown in the x-axis. The y-axis represents the genotype probability for Brazilians and the observed genotype frequency for the African and Portuguese cohorts. Data from Suarez-Kurtz et al. (2010). The plot for Brazilians was generated as described in Figure 5.

