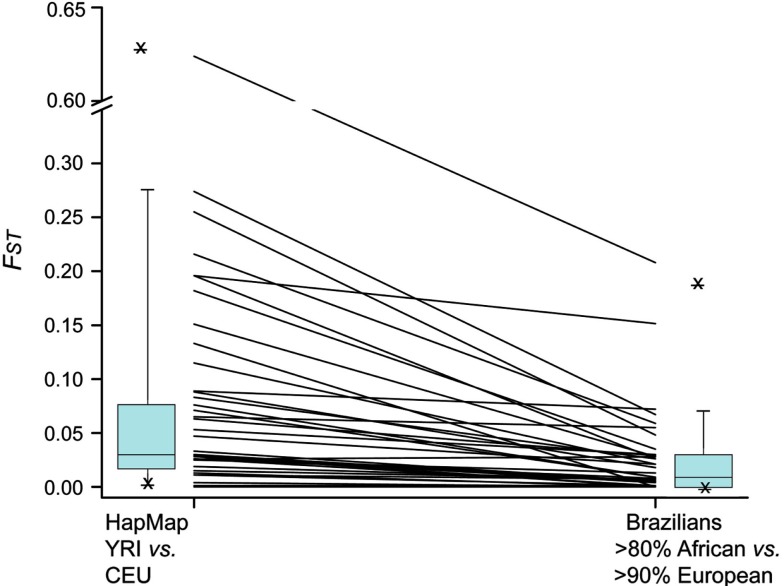
Figure 7.
Allele-specific FST values for 38 PGx polymorphisms in HapMap CEU vs. YRI and in Brazilians with >90% European ancestry vs. Brazilians with >80% African ancestry. The lines connect the FST values for each polymorphism in the two data sets and the box plots at the left and right summarize the ensemble of the data for each set.

