
Figure 2.
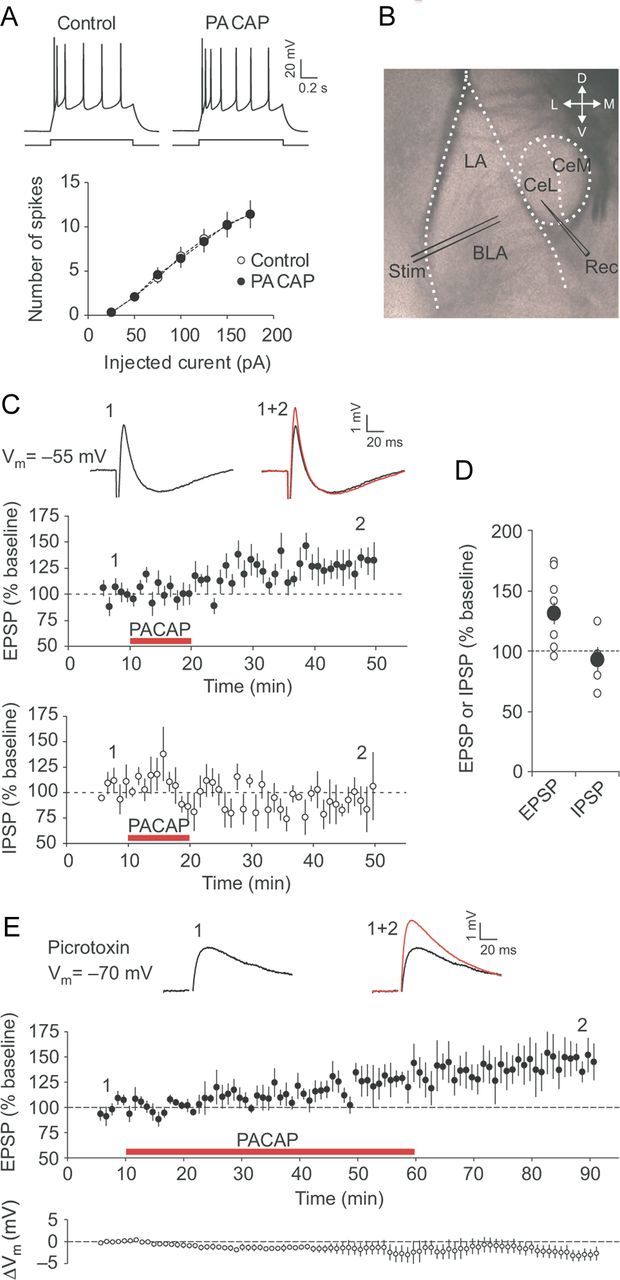
PACAP potentiates excitatory transmission in the BLA to the CeL pathway. A, Summary plots of the number of action potentials in CeL neurons evoked by current injections of increasing intensity before (open circles) and after 10 min application of PACAP38 (5 nm; filled circles; n = 6). The traces on top represent responses of CeL neurons to depolarizing current injection (100 pA; 1 s) recorded in current-clamp mode under control conditions and after application of PACAP38. B, Representation of the slice preparation, showing locations of stimulation (Stim) and recording (Rec) electrodes. Synaptic responses were evoked by stimulation of the BLA and recorded from neurons in the CeL. C, Summary graphs demonstrating the time course of EPSP (top graph, filled circles; n = 10) and IPSP (bottom graph, open circles; n = 5) amplitude changes produced by PACAP38 application (red horizontal bars). The insets show the average of 10 biphasic synaptic responses in a CeL neuron before (black trace) and after (red trace) PACAP38 application. The EPSP/IPSP sequences were recorded at a slightly depolarized membrane potential (−55 mV) to increase the driving force for Cl− currents underlying GABAA receptor-mediated IPSPs. D, Summary of the EPSP (n = 10) and IPSP (n = 5) amplitude changes 35–40 min after the start of PACAP application for the experiments shown in C. The larger filled circles represent mean values. E, Top graph, The time course of EPSP amplitude changes in the presence of 50 μm PTX before and after PACAP38 application (red horizontal bar; n = 7). EPSPs were recorded in CeL neurons in current-clamp mode at −70 mV. The bottom graph shows the time course of changes in the resting membrane potential, ΔVm, relative to the pre-PACAP value. The insets show averaged BLA–CeL EPSPs recorded before (black trace) and after (red trace) PACAP38 application. Error bars indicate SEM.