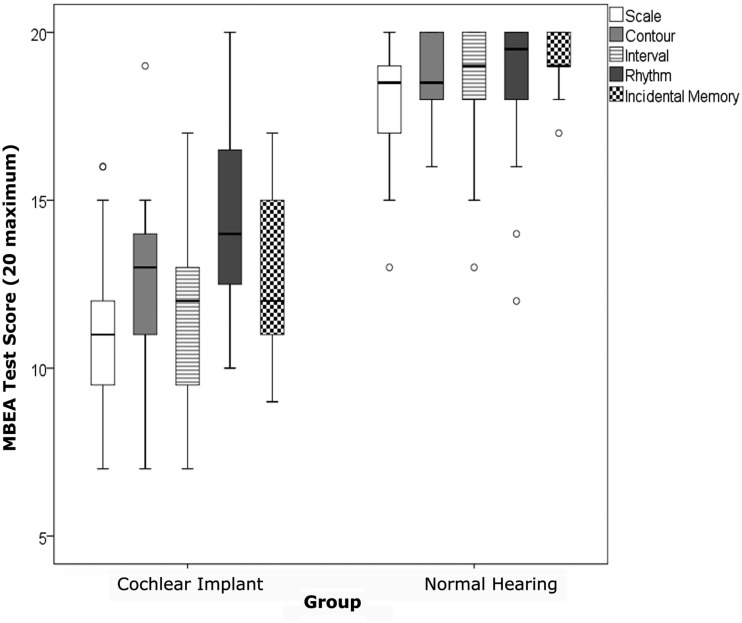
Figure 3.
Boxes indicate the data falling between the 25th and 75th percentile and the whiskers indicate the 95% confidence intervals. The median scores are indicated by the thick black horizontal line. Scores on all tests were significantly better in the normal hearing group compared to the cochlear implant group. The cochlear implant group were most accurate on the Rhythm test.

