Figure 2.

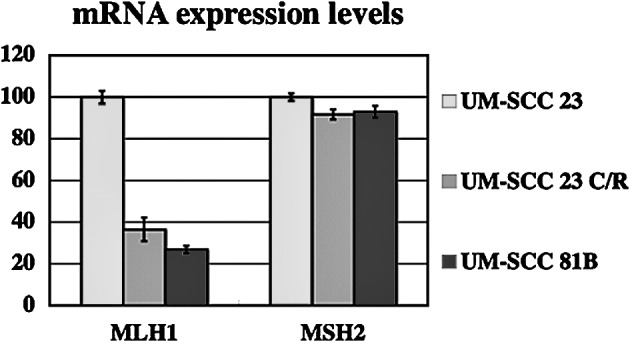
mRNA expression levels of hMLH1 and hMSH2. UM-SCC 23, UM-SCC 81B and UM-SCC 23 C/R cells were analyzed using real-time RT-PCR. Each data point is the mean of three independent experiments. Vertical bars represent standard deviations.

mRNA expression levels of hMLH1 and hMSH2. UM-SCC 23, UM-SCC 81B and UM-SCC 23 C/R cells were analyzed using real-time RT-PCR. Each data point is the mean of three independent experiments. Vertical bars represent standard deviations.