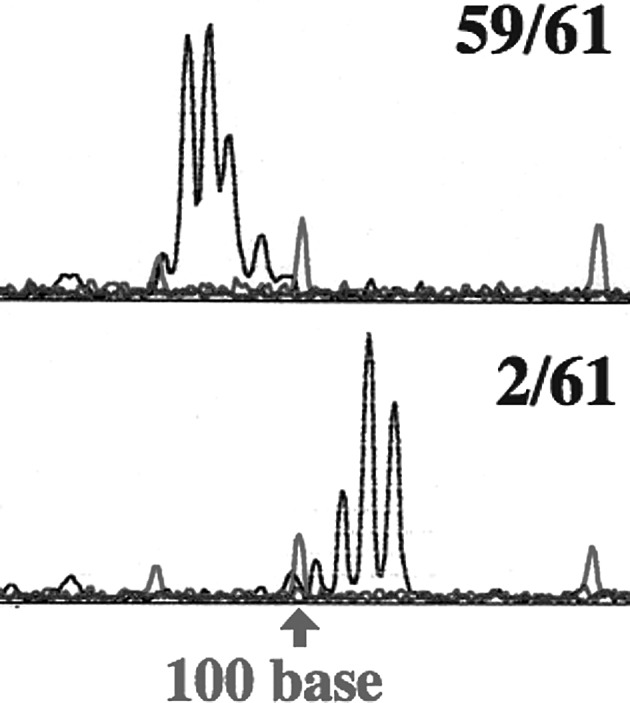
Figure 4.

Changes in the microsatellite sequence. Microsatellite sequence changes were detected with Gene Scan. Results in D9S171 for UM-SCC 81B are shown. The upper column shows results noted in 59 of 61 samples, the lower column shows microsatellite sequence changes in 2 of 61 samples. The red lines indicate base size marker and the black lines indicate the samples. The arrow shows 100 bases.
