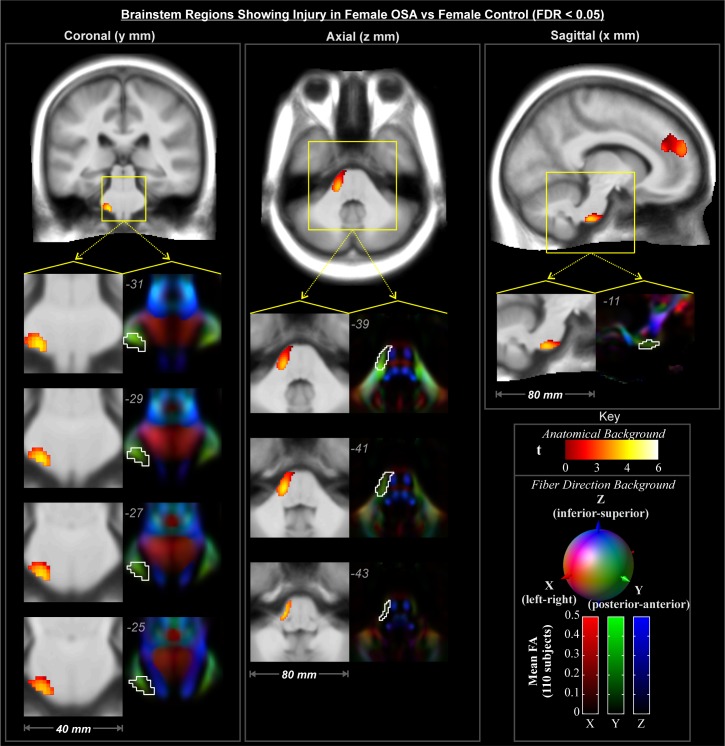
Figure 5.
Brainstem regions showing significant interaction effects (Figure 2E) with post-hoc tests of significant female-OSA compromised structures (lower FA) relative to female-control (FDR < 0.05), color-coded according to significance level; numbers indicate locations in MNI coordinates (mm). Backgrounds are the average of 80 subjects' spatially normalized T1 anatomical volumes (grayscale), and DTI-derived tensor 1st eigenvector direction images (color).

