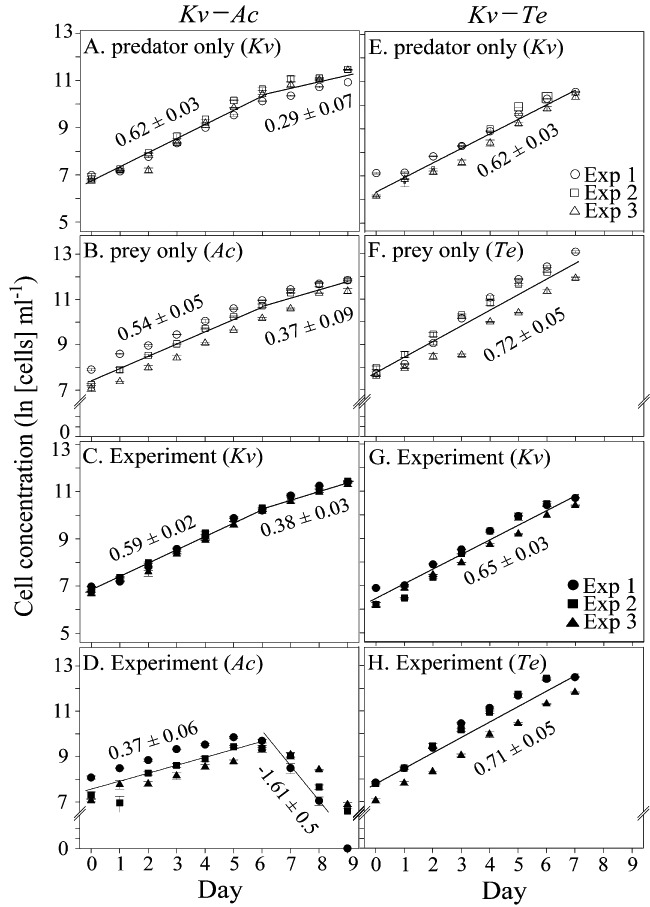
Fig 1.

Concentrations of (A, E) K. veneficum in the predator controls; (B) A. carterae and (F) Teleaulax sp. in the prey controls; (C) K. veneficum and (D) A. carterae in treatments involving incubation of K. veneficum with A. carterae (Kv–Ac); and (G) K. veneficum and (H) Teleaulax sp. in treatments involving incubation of K. veneficum with Teleaulax sp. (Kv–Te). Different symbols represent different pseudo-replicate experiments, and open and filled symbols indicate the control and experimental bottles respectively. Error bars for cell concentrations (not clearly shown, as they are smaller than the symbols) indicate the differences of two measurements from the mean. The solid lines and numbers represent the best fits of data and growth rates respectively.
