
Fig 2.
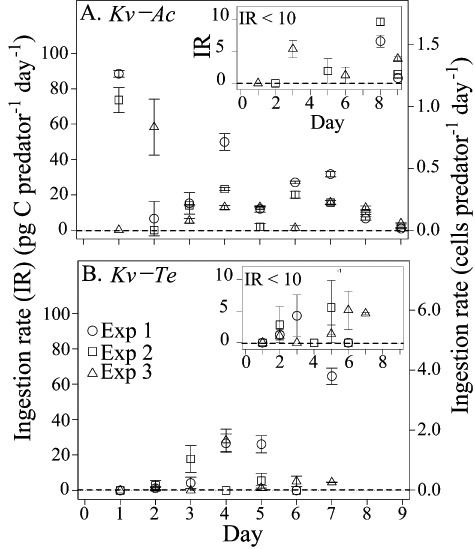
Ingestion rate (IR) (pg C predator−1 day−1) as a function of time (day) in experiment bottles containing (A) K. veneficum and A. carterae (Kv–Ac) or (B) K. veneficum and Teleaulax sp. (Kv–Te). Different symbols represent different pseudo-experiments. Error bars for ingestion rate indicate the differences of two measurements from the mean. The insets in (A) and (B) only show data with IR < 10 pg C predator −1 day−1 to better visualize these data.