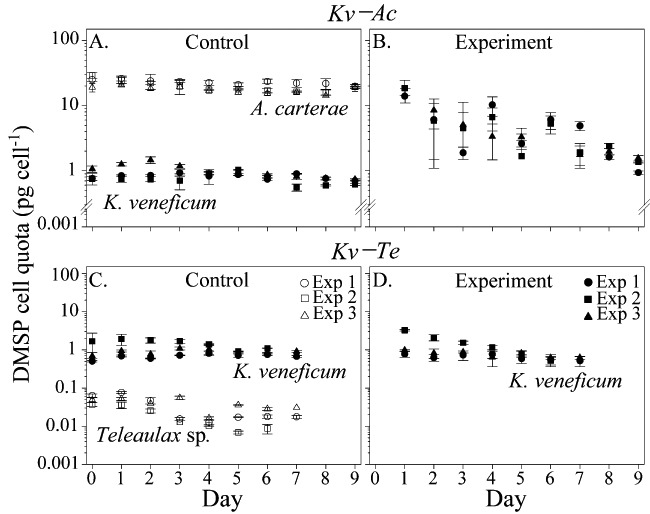
Fig 4.

Evolution of the cellular contents of DMSP (pg cell−1) in K. veneficum (predator; filled symbols), and A. carterae and Teleaulax sp. (prey; open symbols) in the control bottles (A, C); and the cellular contents of DMSP (pg cell−1) in K. veneficum during mixotrophy in experimental bottles containing (B) K. veneficum and A. carterae (Kv–Ac) or (D) K. veneficum and Teleaulax sp. (Kv–Te). Different symbols represent three different pseudo-replicate experiments. Error bars for cellular contents of DMSP indicate the standard deviations from the mean of replicate measurements.
