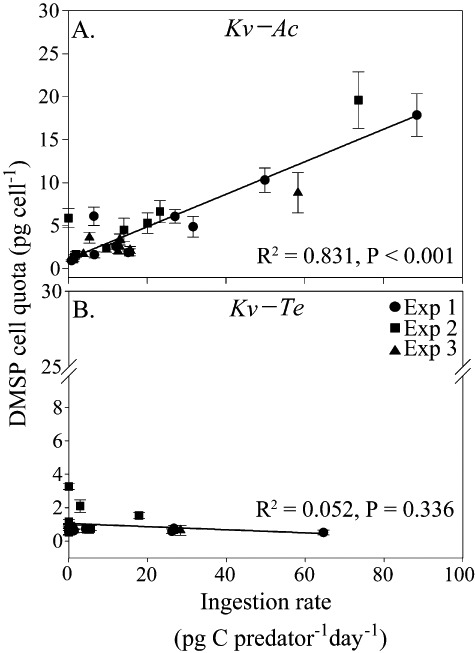
Fig 5.

Cellular contents of DMSP (pg cell−1) in the predator K. veneficum during mixotrophy as a function of ingestion rate (pg C predator−1 day−1) with (A) A. carterae (Kv–Ac) and (B) Teleaulax sp. (Kv–Te) as prey. Different symbols represent different pseudo-replicate experiments. The solid lines in (A) and (B) are the best fits of data. Error bars for cellular contents of DMSP indicate the standard deviations from the mean of replicate measurements.
