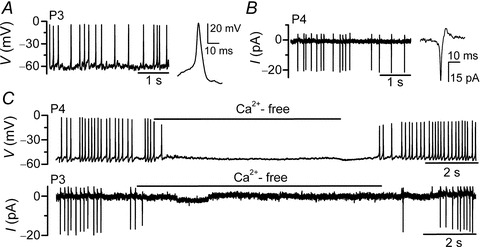
Figure 5. Spontaneous Ca2+-dependent action potentials in IHCs.

A and B, spontaneous electrical activity in immature IHCs recorded with whole-cell current clamp (A) and cell-attached voltage clamp (B). C, recordings of whole-cell (top panels) and cell-attached spontaneous action potentials (bottom panels) in IHCs with the superfusion of a Ca2+-free solution. P3 and P4 indicate postnatal day 3 and 4, respectively. Figure modified from Johnson et al. (2011b).
